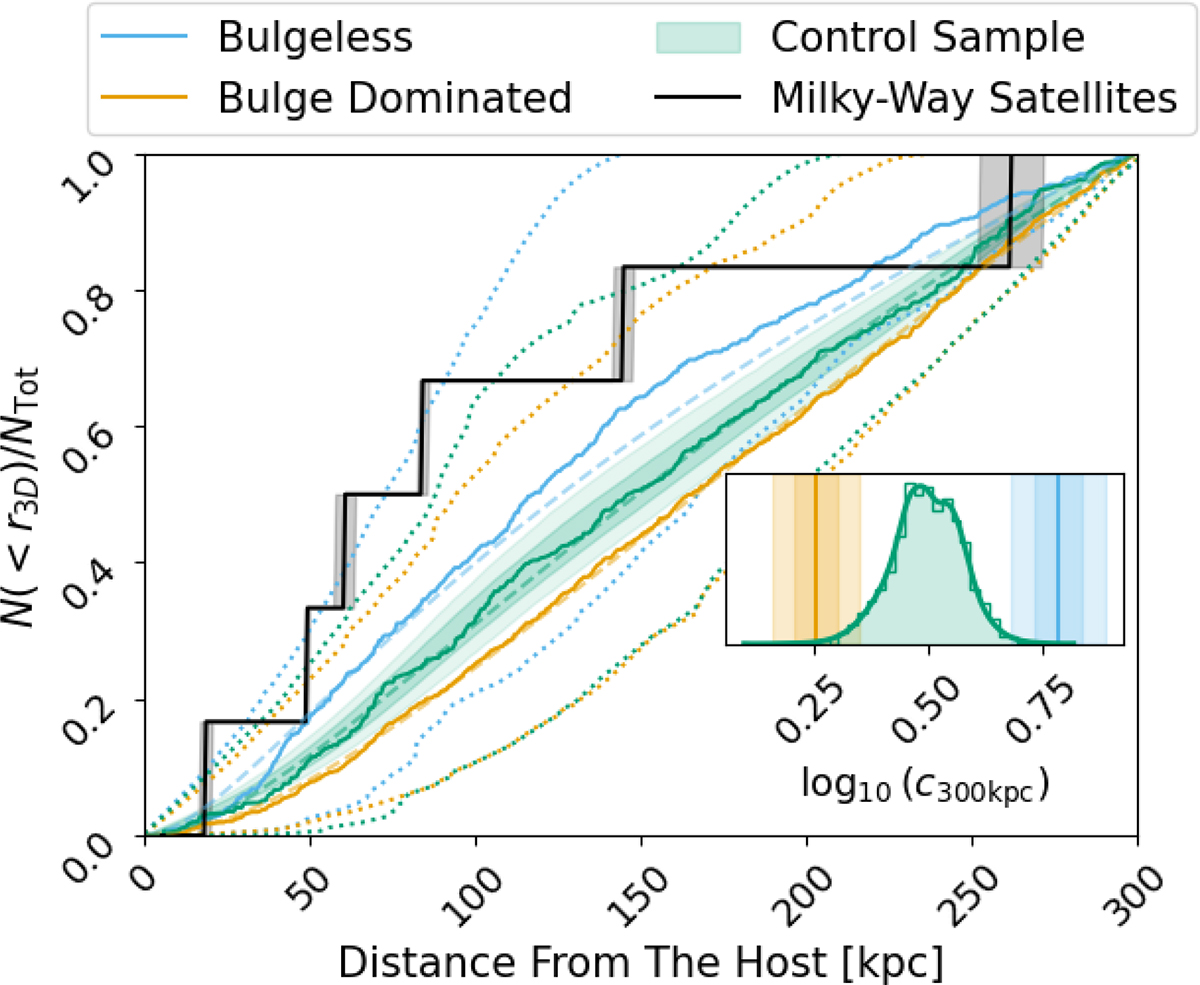
Fig. 7.
Download original image
Stacked empirical cumulative distribution function of the radial position of the satellites galaxies of the BL (blue), BD (orange), and CS (green) samples. The CS shows the 1σ and 2σ confidence intervals estimated over 1000 re-samplings as green bands. The dotted lines indicate the 1σ scatter due to halo-to-halo variance. Black line shows the distribution of MW satellites whose positions and errors have been obtained from Pace (2025). The shadow black region indicates the 1σ confidence region due to observational uncertainties in the distance measurements. Dashed lines indicate the best fit to an NFW radial distribution. The resulting concentrations c300 kpc from the fit are shown in the inserted panel in the bottom right of the figure. The MLE of c300 kpc for the BL (blue) and BD (orange) samples are shown as a vertical line, the shaded bands indicate 68% and 95% confidence region. Regarding the CS we show the distribution of the 1000 MLE estimations of c300kpc as a green PDF.
Current usage metrics show cumulative count of Article Views (full-text article views including HTML views, PDF and ePub downloads, according to the available data) and Abstracts Views on Vision4Press platform.
Data correspond to usage on the plateform after 2015. The current usage metrics is available 48-96 hours after online publication and is updated daily on week days.
Initial download of the metrics may take a while.