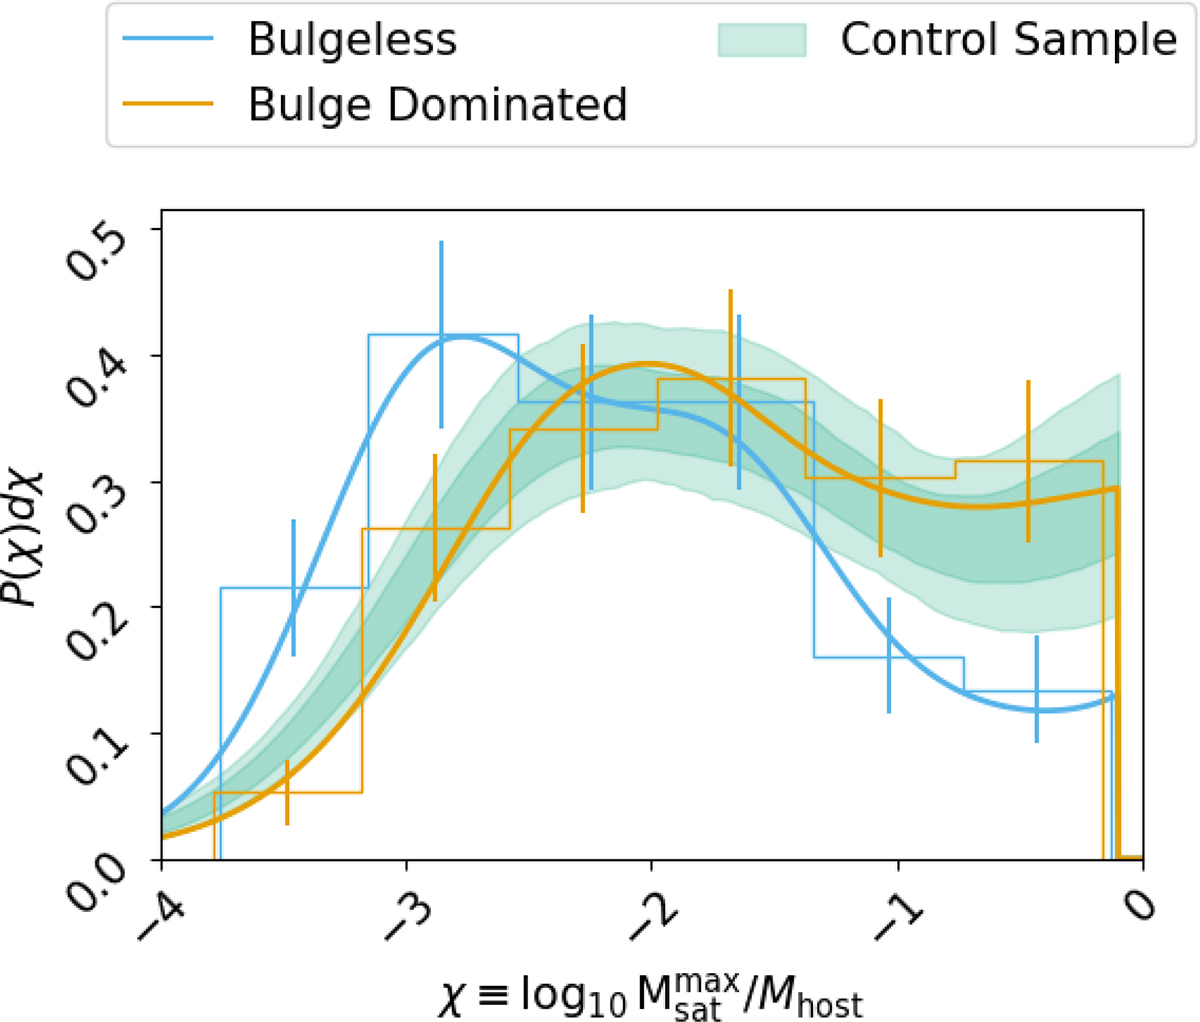
Fig. 6.
Download original image
Distribution of the ratio between the stellar mass of the most massive satellite and its host galaxy for the BL sample (blue), BD sample (orange), and CS (green). Error bars indicate 1σ Poisson uncertainty. Solid lines are KDE estimations. The green bands encompass the 68% and 95% confidence regions of the estimated PDFs over the 1000 realisations of the CS.
Current usage metrics show cumulative count of Article Views (full-text article views including HTML views, PDF and ePub downloads, according to the available data) and Abstracts Views on Vision4Press platform.
Data correspond to usage on the plateform after 2015. The current usage metrics is available 48-96 hours after online publication and is updated daily on week days.
Initial download of the metrics may take a while.