Fig. 5.
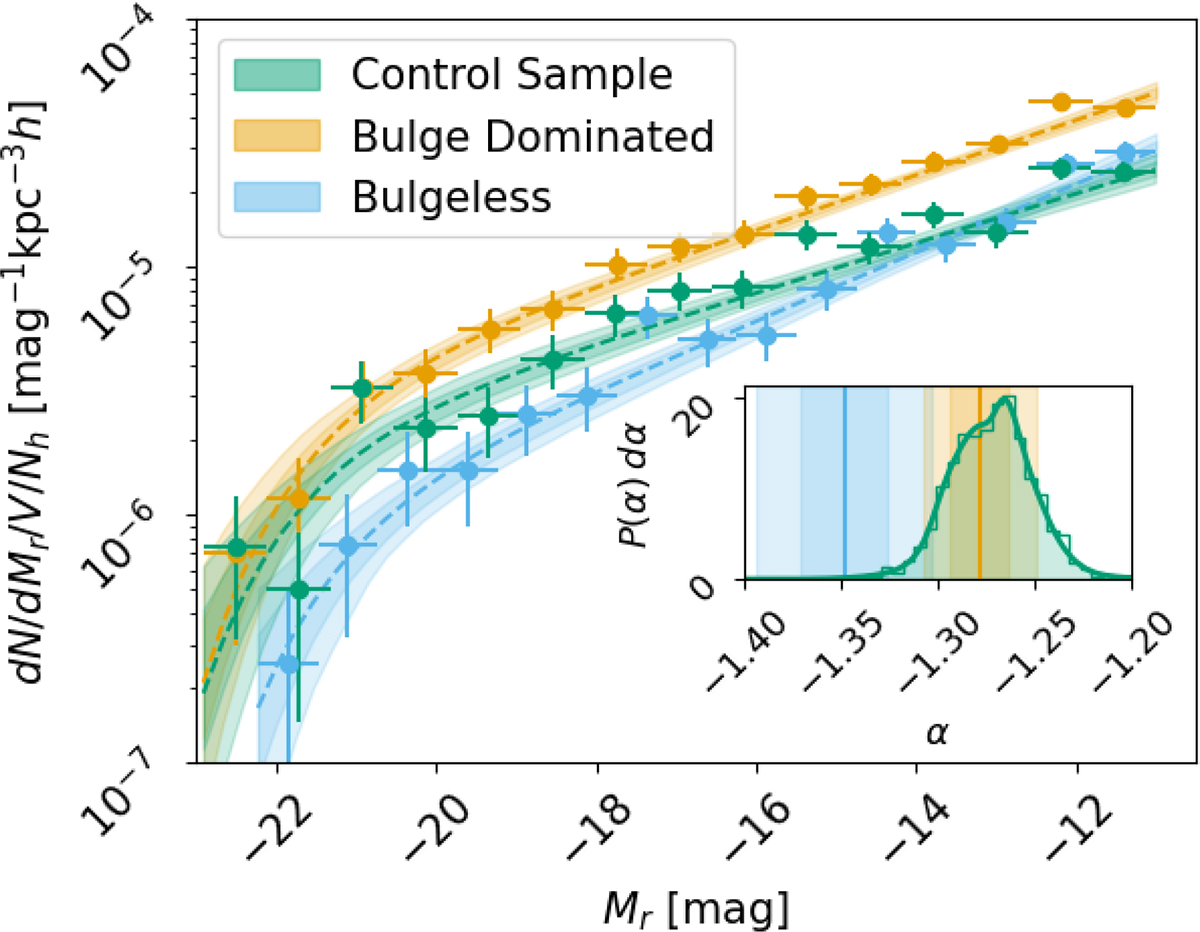
Download original image
Stacked satellite LFs of the BD (orange), BL (blue) and one realisation of the CS. Shaded regions indicate the 68% and 95% confidence intervals. Error bars in the data points indicate the 1σ Poisson uncertainty (y-axis) and the bin width (x-axis). Luminosity functions have not been fitted to these data-points but to the full distribution (see Sect. 4.2 for details). For visualisation purposes for the CS we show only one random realisation. Inset plot: Mean and scatter (1σ and 2σ) of the marginalised distribution of the faint end slope for the BL and BD samples. For the CS sample we show the distribution of the maximum a posteriori estimates of the faint end slope α over the 1000 realisations.
Current usage metrics show cumulative count of Article Views (full-text article views including HTML views, PDF and ePub downloads, according to the available data) and Abstracts Views on Vision4Press platform.
Data correspond to usage on the plateform after 2015. The current usage metrics is available 48-96 hours after online publication and is updated daily on week days.
Initial download of the metrics may take a while.