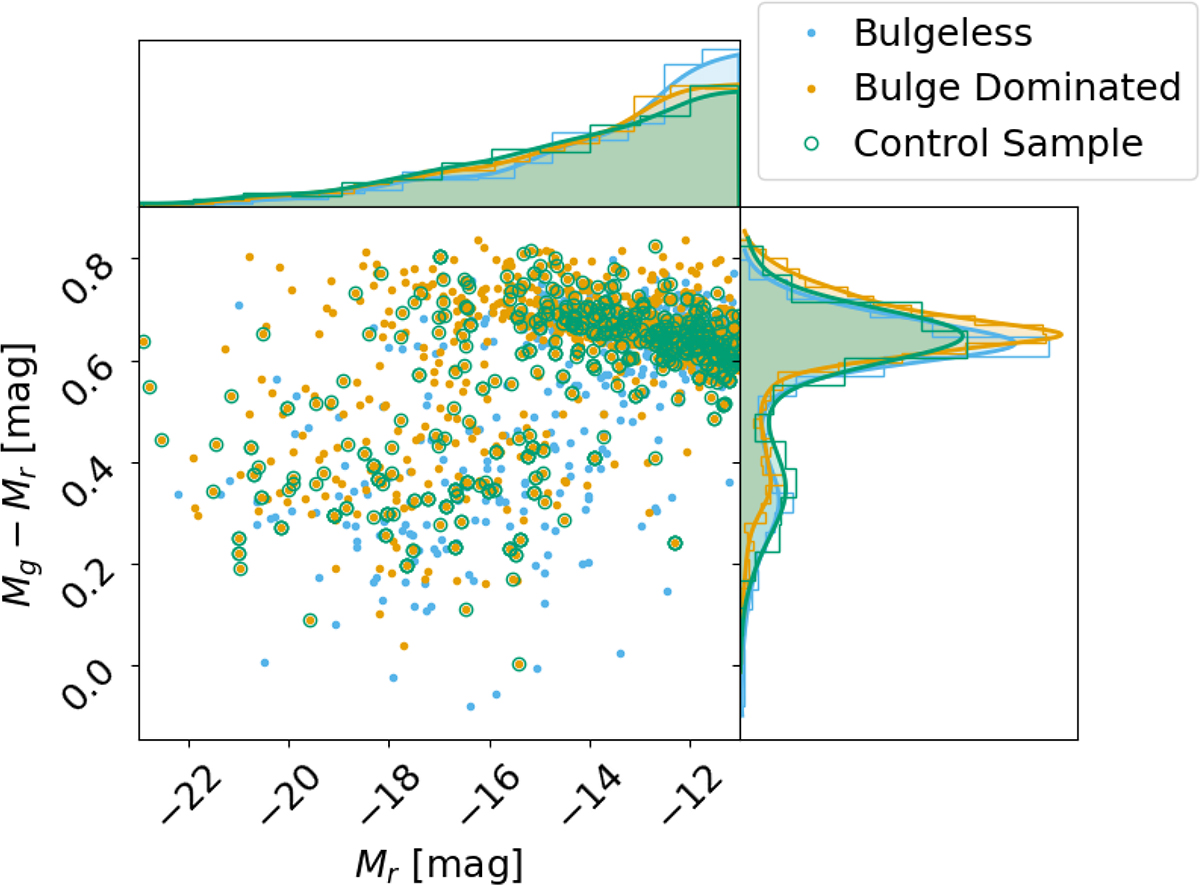
Fig. 4.
Download original image
Colour–magnitude diagram of satellite galaxies. Satellites from BL galaxies are in blue, from BD galaxies in orange, and from the CS in green. Each point represents a satellite galaxy in the sample. While the colour distributions are similar across populations, BL satellites show a noticeable excess at faint magnitudes. For visualisation purposes only one realisation of the CS is shown. Top and right panels show the 1D distribution of r band magnitude and colour respectively. Distributions are shown via KDE (thick lines) and normalised histograms (thin lines).
Current usage metrics show cumulative count of Article Views (full-text article views including HTML views, PDF and ePub downloads, according to the available data) and Abstracts Views on Vision4Press platform.
Data correspond to usage on the plateform after 2015. The current usage metrics is available 48-96 hours after online publication and is updated daily on week days.
Initial download of the metrics may take a while.