Fig. 3.
Download original image
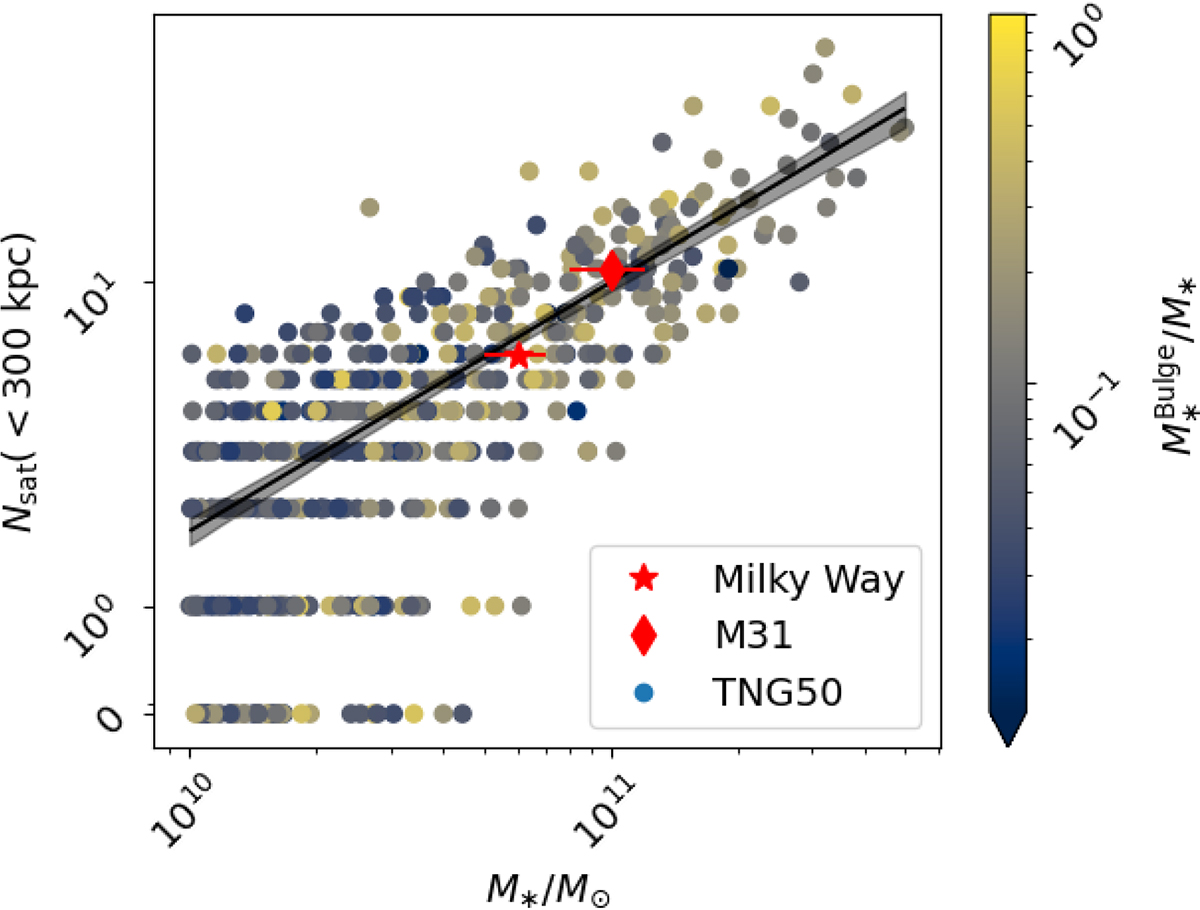
Number of satellite galaxies as function of the host’s galaxy stellar mass colour-coded by the host galaxy bulge-to-total mass ratio (B/T). Note that the y-axis switches from linear to logarithmic scaling at Nsat = 1. The black line shows a power law fit, while the shaded region indicates the 95% confidence interval, estimated from the NB regression. For comparison we include the values of the MW and Andromeda galaxies. The stellar masses have been obtained from Licquia & Newman (2015) and Sick et al. (2015) respectively. The satellite number counts were obtained from the Pace (2025) database, mimicking our satellite selection criteria (see Section 3.2).
Current usage metrics show cumulative count of Article Views (full-text article views including HTML views, PDF and ePub downloads, according to the available data) and Abstracts Views on Vision4Press platform.
Data correspond to usage on the plateform after 2015. The current usage metrics is available 48-96 hours after online publication and is updated daily on week days.
Initial download of the metrics may take a while.