Fig. C.1.
Download original image
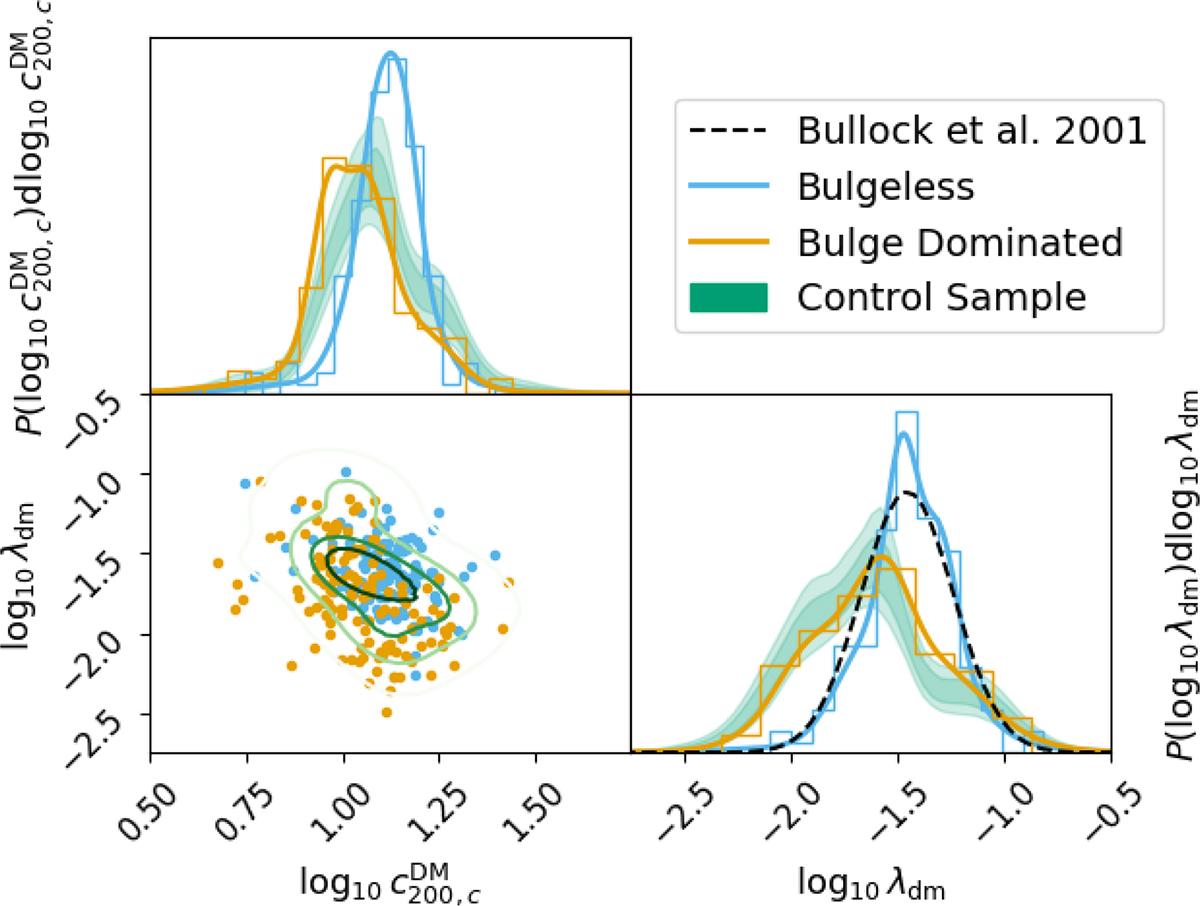
Corner plot showing the joint and marginal distributions of dark matter halo concentration, ![]() , and spin parameter, λ, for the BL (blue), BD (orange) and CS (green). Diagonal panels show the normalised marginal distribution. Shaded bands indicate 1σ and 2σ confidence regions over the 1000 realisations of the CS. Concentrations are obtained via an NFW fit to the DM density profile from Anbajagane et al. (2022) The 2D contours indicate the 0.5σ, 1σ, 1.5σ and 2σ confidence regions. Black line dashed in bottom right panel indicates the expected spin parameter λdm distribution from Bullock et al. (2001).
, and spin parameter, λ, for the BL (blue), BD (orange) and CS (green). Diagonal panels show the normalised marginal distribution. Shaded bands indicate 1σ and 2σ confidence regions over the 1000 realisations of the CS. Concentrations are obtained via an NFW fit to the DM density profile from Anbajagane et al. (2022) The 2D contours indicate the 0.5σ, 1σ, 1.5σ and 2σ confidence regions. Black line dashed in bottom right panel indicates the expected spin parameter λdm distribution from Bullock et al. (2001).
Current usage metrics show cumulative count of Article Views (full-text article views including HTML views, PDF and ePub downloads, according to the available data) and Abstracts Views on Vision4Press platform.
Data correspond to usage on the plateform after 2015. The current usage metrics is available 48-96 hours after online publication and is updated daily on week days.
Initial download of the metrics may take a while.