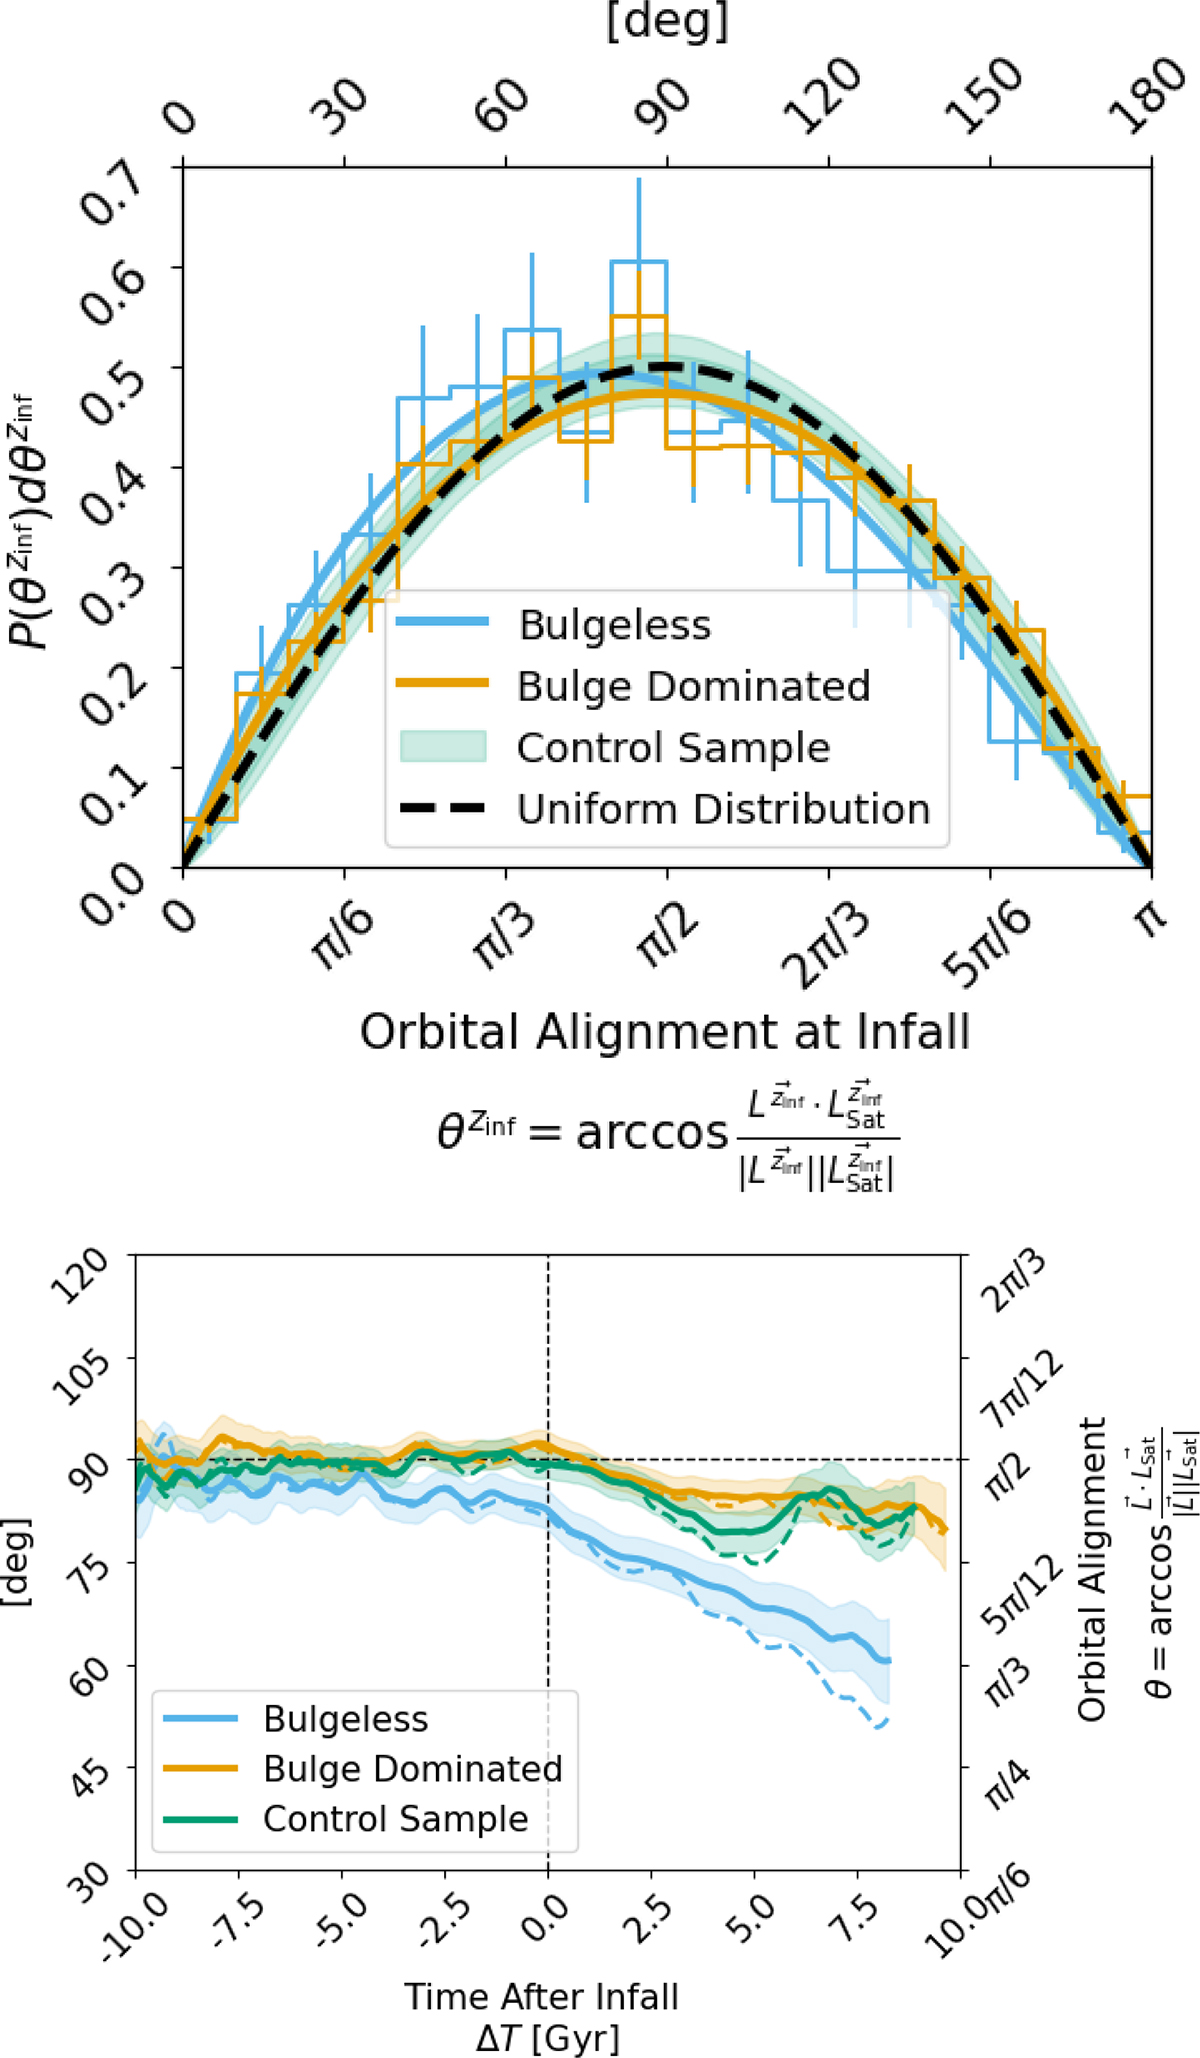
Fig. 10.
Download original image
Top panel: Distribution of satellite orbital alignment, at infall time, with respect to host stellar angular momentum computed within 1 half mass radius. BL in blue, BD in orange and CS in green. Error bars in the histogram indicate 1σ Poisson scatter. Solid thick lines show the best fitting beta distribution. Green band indicates the 1σ and 2σ interval of the best fitted beta distribution to the 1000 realisations of the CS. Black dashed line indicates what we would expect from an isotropic distribution of satellite orbits. Bottom panel: Evolution of the mean (median) orbital alignment relative to the satellite infall time as a solid (dashed) line. We only show bins with more than 100 satellites. The shaded band indicates the 1σ uncertainty estimated via bootstrap resampling. Black horizontal thin dashed line at 90 deg indicates the expected value of an isotropic distribution.
Current usage metrics show cumulative count of Article Views (full-text article views including HTML views, PDF and ePub downloads, according to the available data) and Abstracts Views on Vision4Press platform.
Data correspond to usage on the plateform after 2015. The current usage metrics is available 48-96 hours after online publication and is updated daily on week days.
Initial download of the metrics may take a while.