Open Access
Fig. 6.
Download original image
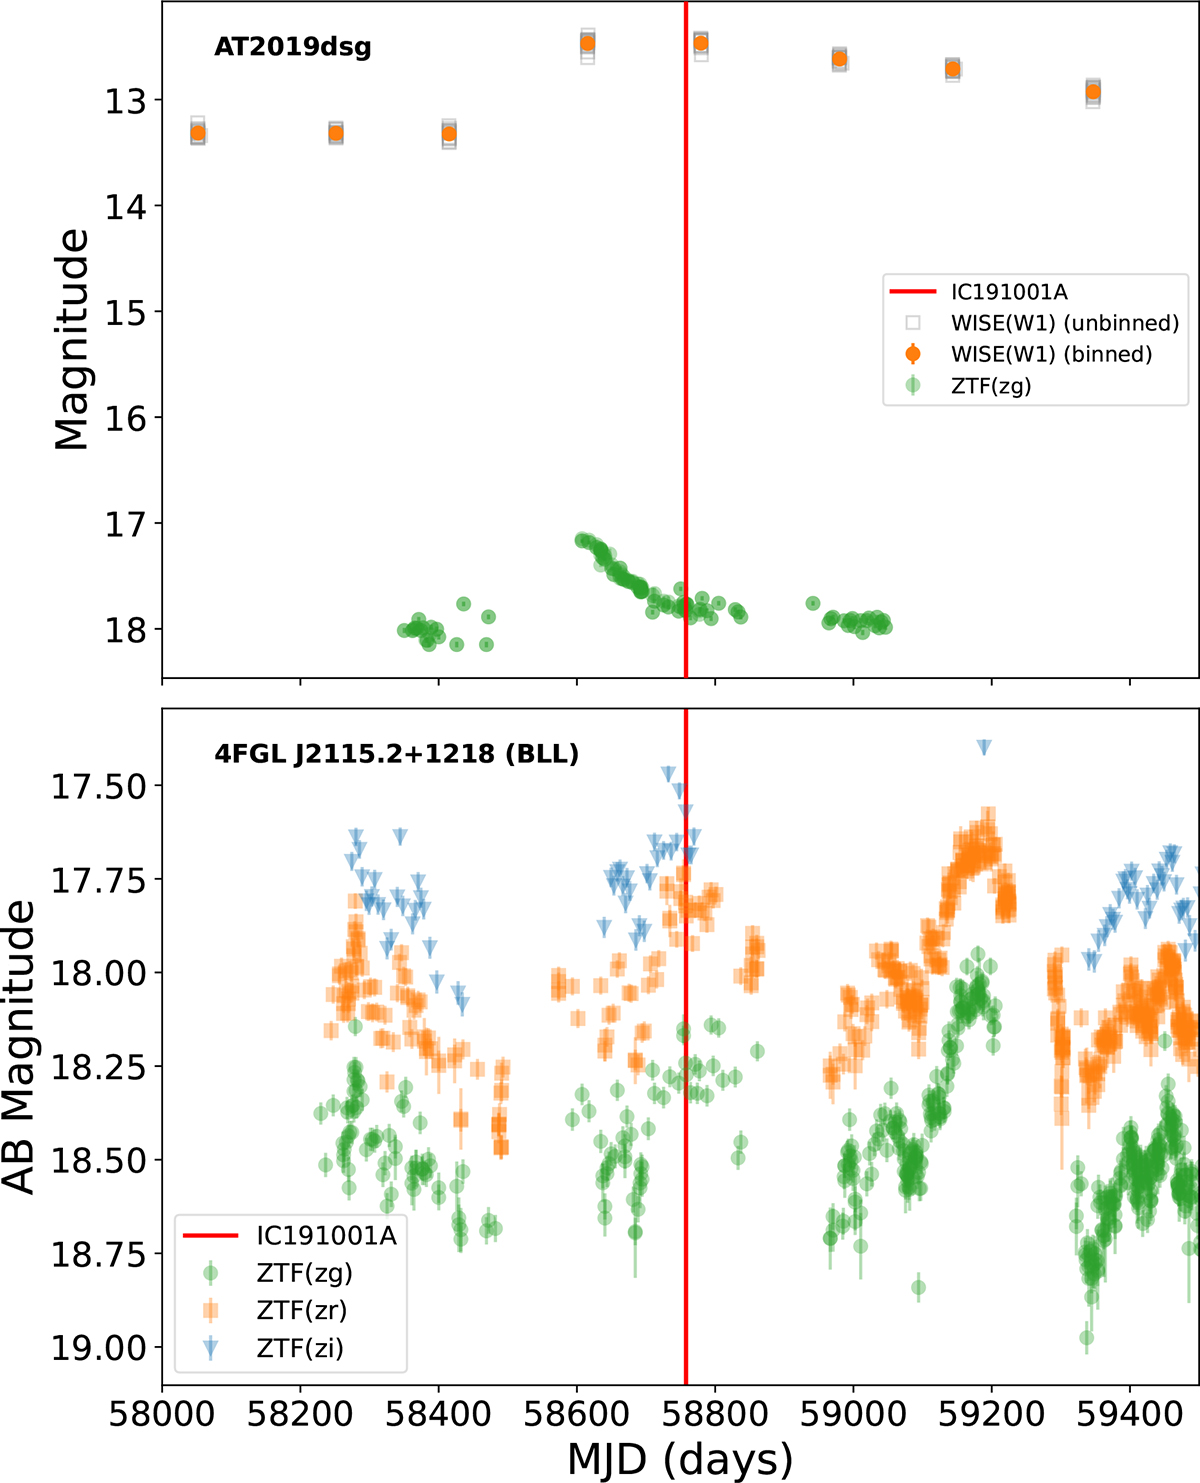
Light curves for TDE AT2019dsg (optical and infrared; upper panel) and 4FGL J2115.2+1218 (optical; bottom panel). The vertical red line indicates the neutrino arrival time of IC19001A.
Current usage metrics show cumulative count of Article Views (full-text article views including HTML views, PDF and ePub downloads, according to the available data) and Abstracts Views on Vision4Press platform.
Data correspond to usage on the plateform after 2015. The current usage metrics is available 48-96 hours after online publication and is updated daily on week days.
Initial download of the metrics may take a while.