Open Access
Fig. 5.
Download original image
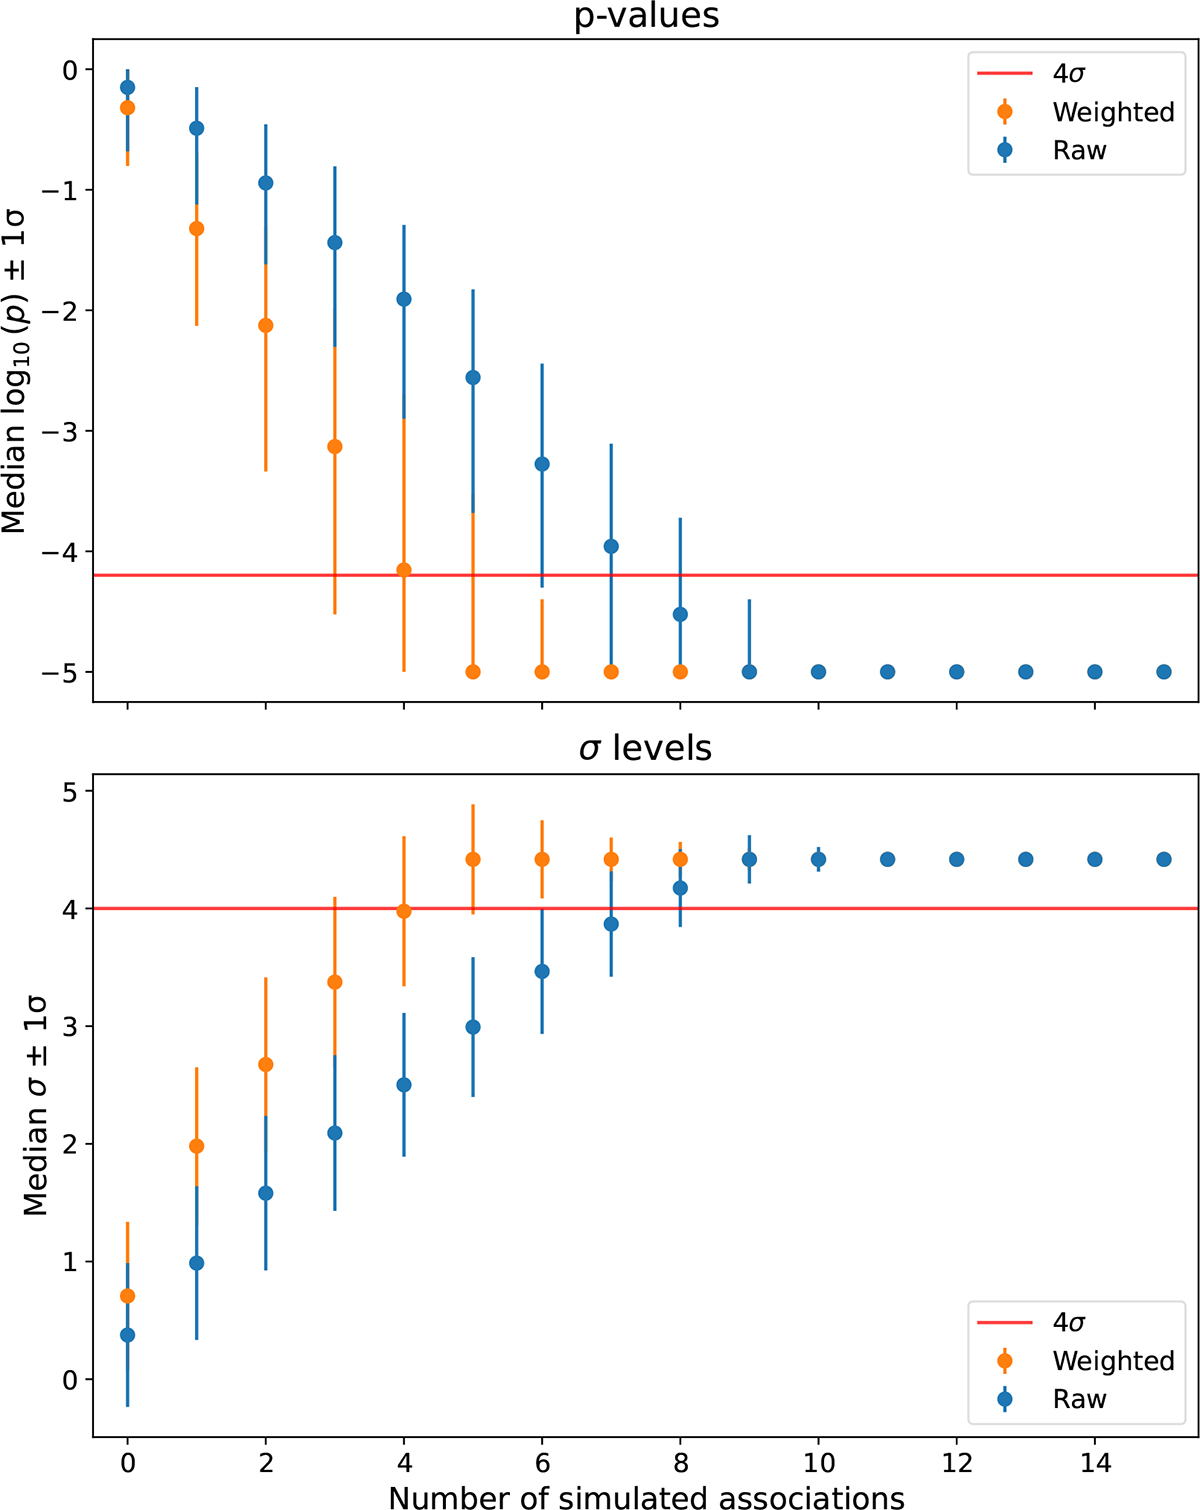
Median p-values and corresponding sigma levels for the weighted (orange) and raw (sky-blue) cases versus the number of simulated associations. The horizontal red lines indicate the p-value equivalent of 4σ (upper panel) and the 4σ threshold (lower panel).
Current usage metrics show cumulative count of Article Views (full-text article views including HTML views, PDF and ePub downloads, according to the available data) and Abstracts Views on Vision4Press platform.
Data correspond to usage on the plateform after 2015. The current usage metrics is available 48-96 hours after online publication and is updated daily on week days.
Initial download of the metrics may take a while.