Open Access
Fig. 4.
Download original image
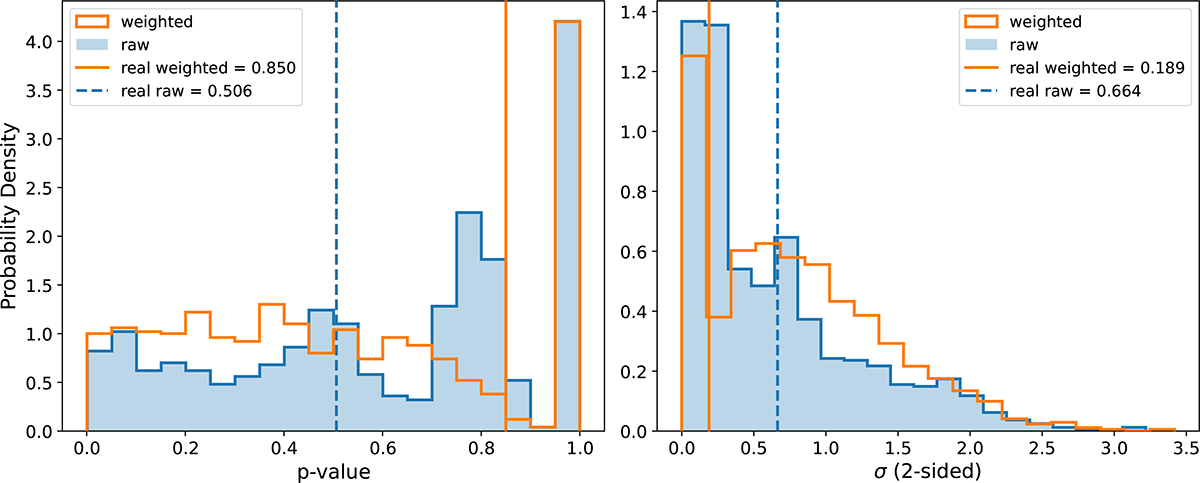
Raw (sky-blue) and weighted (orange) p-value and sigma-level distributions from the random data simulations of 1000 generated datasets (see Sect. 3.2.2). The vertical lines indicate the real values raw (blue) and weighted (orange) values from the observed data.
Current usage metrics show cumulative count of Article Views (full-text article views including HTML views, PDF and ePub downloads, according to the available data) and Abstracts Views on Vision4Press platform.
Data correspond to usage on the plateform after 2015. The current usage metrics is available 48-96 hours after online publication and is updated daily on week days.
Initial download of the metrics may take a while.