


Fig. B.2
Download original image
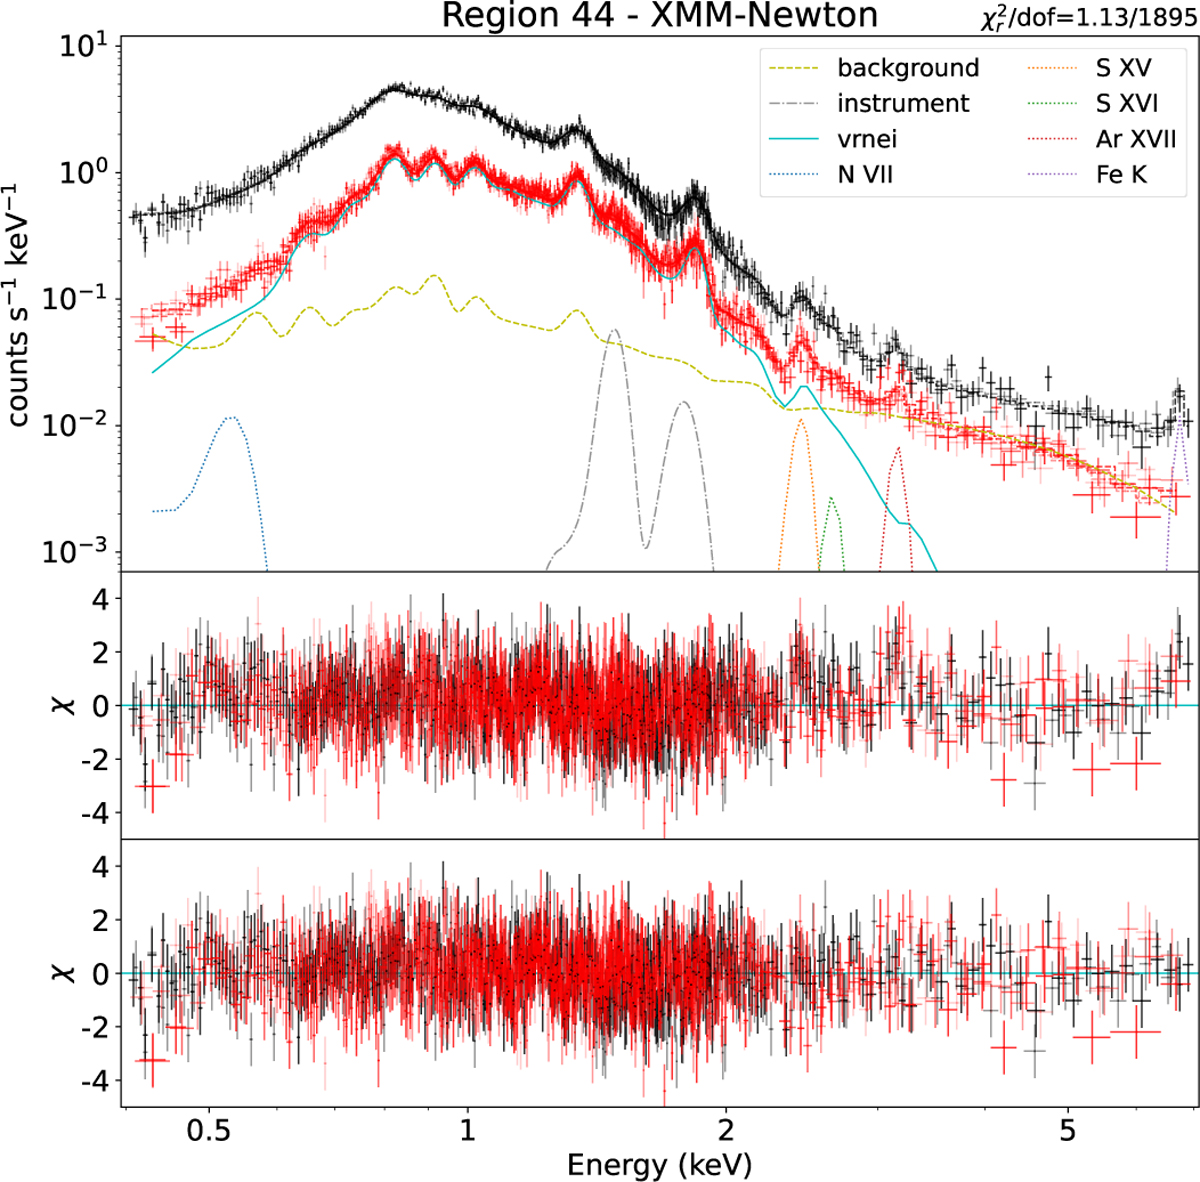
Upper panel: XMM-Newton pn (marked in black) and MOS (marked in red) spectra of the NE shell (Region 44). Dashed lines show the model folded with the response file. Different levels of transparency stand for different observations and different cameras (i.e., MOS 1 and 2). The components of one MOS spectra were displayed as well, including the astrophysical background (the yellow dashed line), instrument fluorescence lines (Al and Si, the grey dash-dot line), overionized plasma (the cyan solid line), and extra Gaussian components for emission lines (dotted lines in different colors). Middle panel: Residuals of the best-fit model without extra line components. Lower panel: Residuals of the best-fit panel.
Current usage metrics show cumulative count of Article Views (full-text article views including HTML views, PDF and ePub downloads, according to the available data) and Abstracts Views on Vision4Press platform.
Data correspond to usage on the plateform after 2015. The current usage metrics is available 48-96 hours after online publication and is updated daily on week days.
Initial download of the metrics may take a while.