


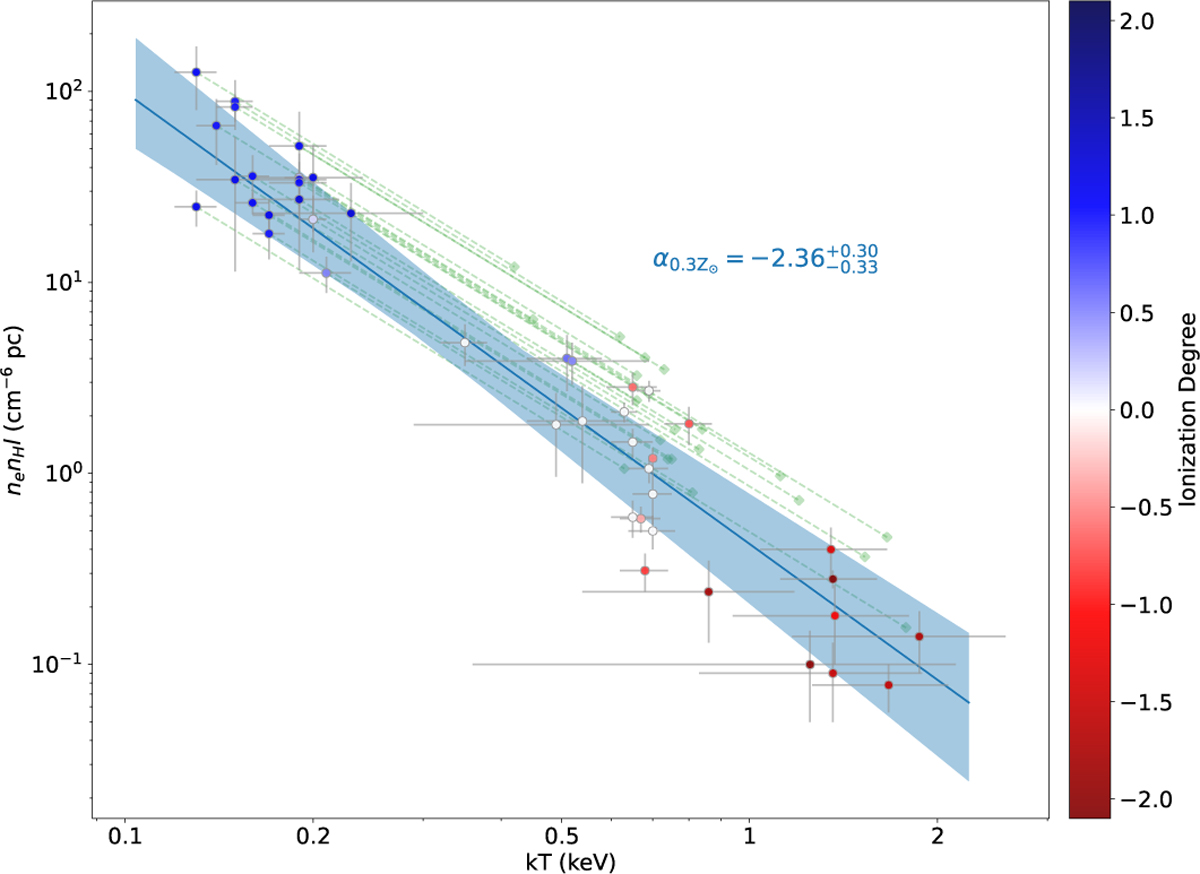
Fig. 7
Download original image
Temperature-EM of the best-fit value of the EM and the temperature (circle dots). The solid blue line shows the best-fit power-law model, and the shadow shows the 90% confidence belt. The green diamonds and dashed lines mark the initial property of the recombining plasma on the assumption of an isobaric cooling. The color of the markers shows the ionization degrees, which are the same as in Fig. 5.
Current usage metrics show cumulative count of Article Views (full-text article views including HTML views, PDF and ePub downloads, according to the available data) and Abstracts Views on Vision4Press platform.
Data correspond to usage on the plateform after 2015. The current usage metrics is available 48-96 hours after online publication and is updated daily on week days.
Initial download of the metrics may take a while.