


Fig. 6
Download original image
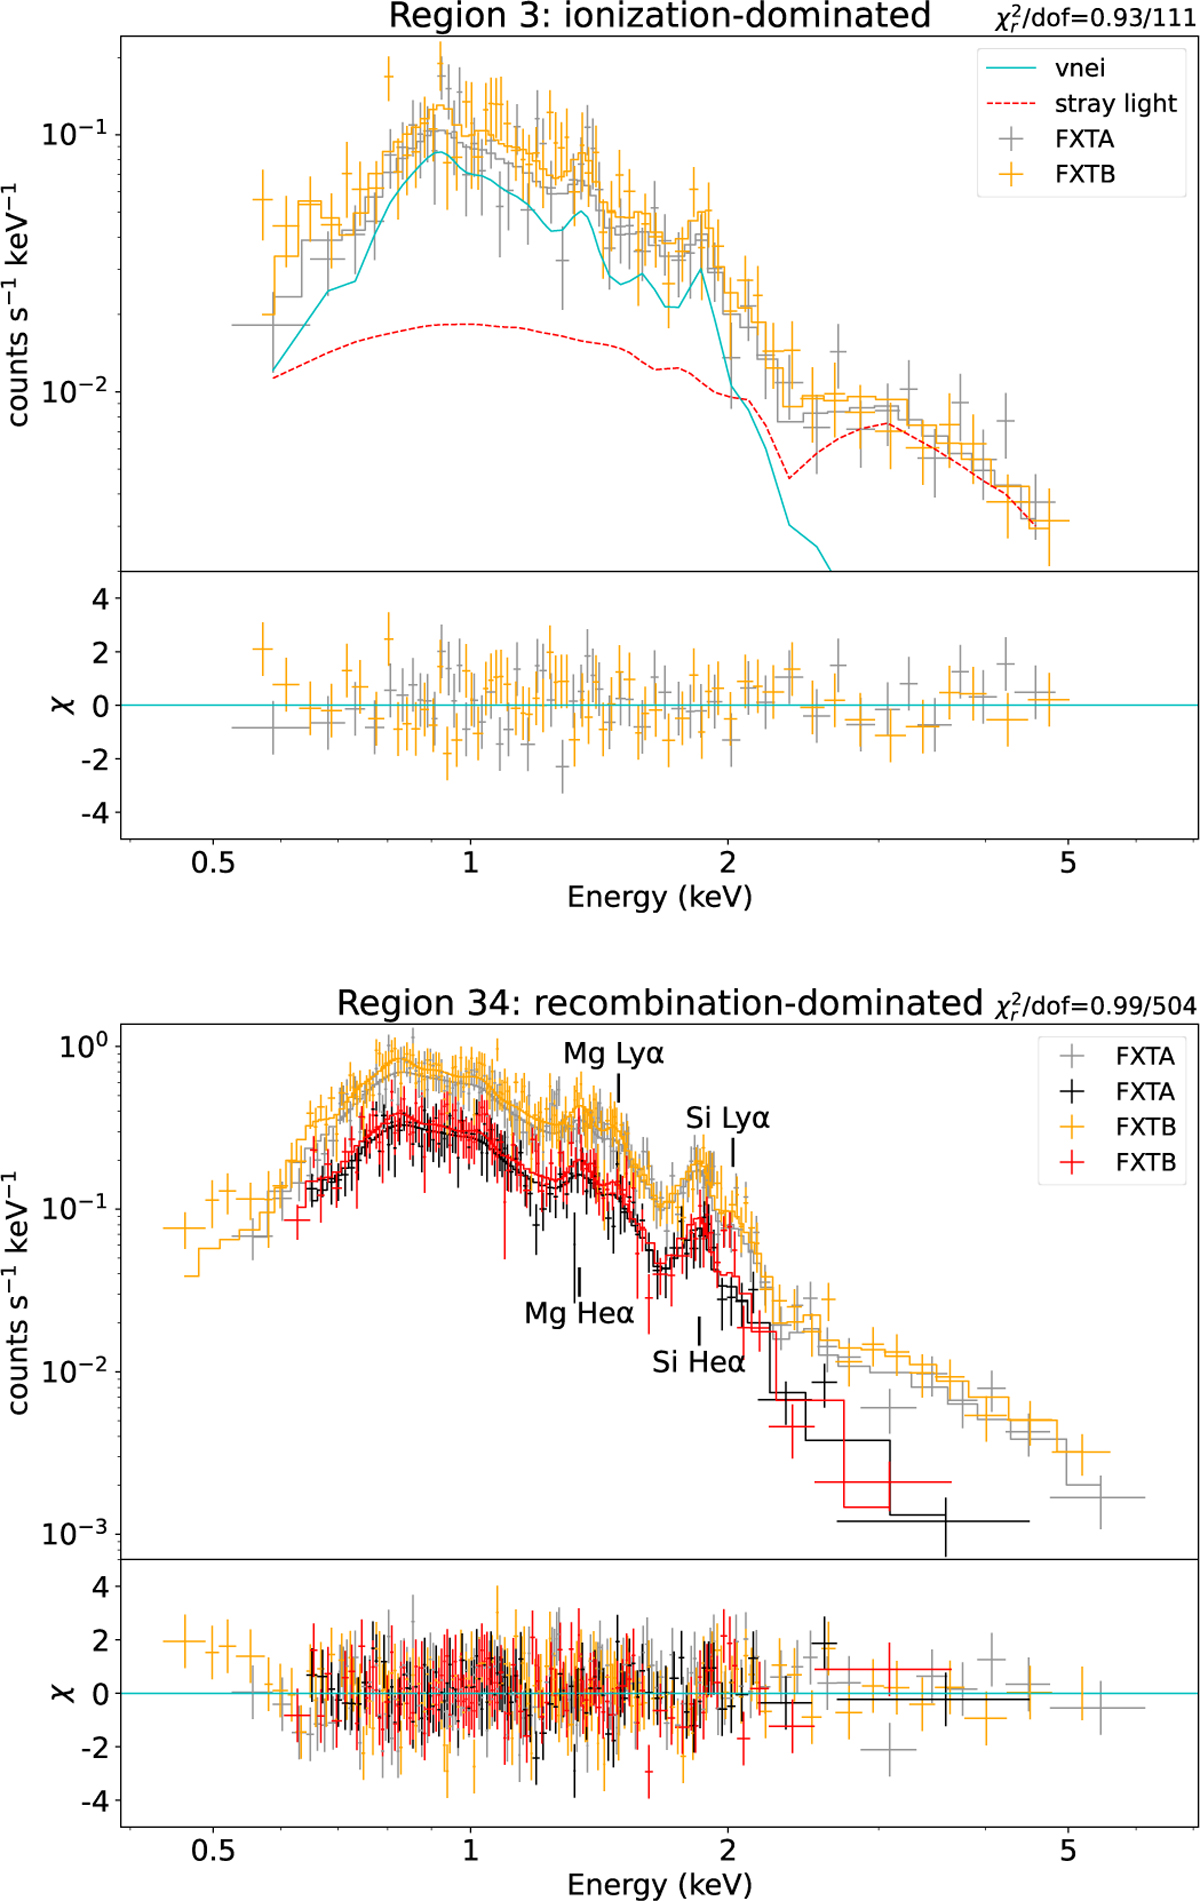
Examples of spectra of underionized plasma (upper panel, region 3 in the western shell) and overionized plasma (lower panel, region 34 in the W28 center). In the upper panel, the contribution of the plasma and the stray light are marked with solid cyan lines and dashed red lines, respectively. The lower panel contains spectra of two observations, of which only the yellow and gray data points are significantly affected by the stray light.
Current usage metrics show cumulative count of Article Views (full-text article views including HTML views, PDF and ePub downloads, according to the available data) and Abstracts Views on Vision4Press platform.
Data correspond to usage on the plateform after 2015. The current usage metrics is available 48-96 hours after online publication and is updated daily on week days.
Initial download of the metrics may take a while.