


Fig. 1
Download original image
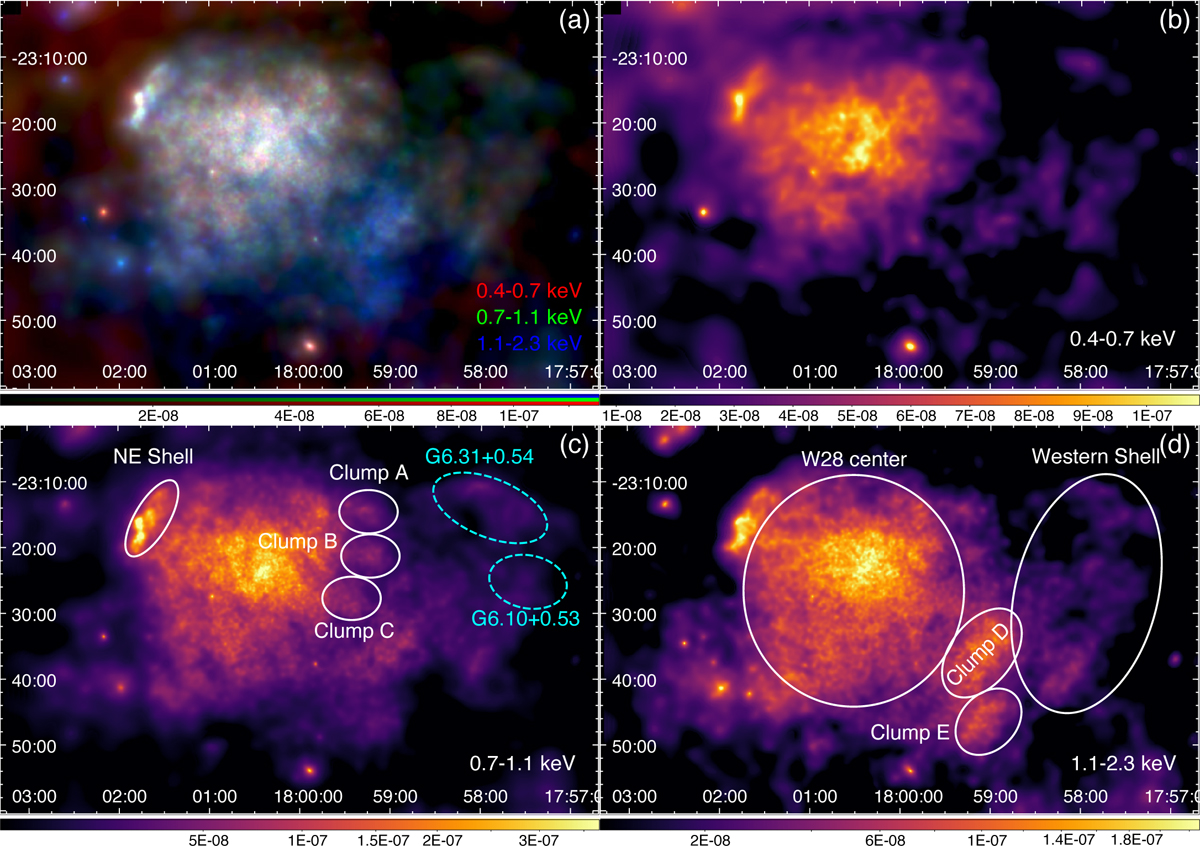
Energy-coded X-ray image of the W28 complex with FXT (a), consisting of bands in 0.4-0.7 keV (red), 0.7-1.1 keV (green), and 1.12.3 keV (blue). The single-band images of each energy band are shown in panels (b), (c), and (d). The images are in units of count s−1 cm−2 and in a square-root color scale to enhance weak emissions. All the images are vignetting-corrected and adaptively smoothed. The structures mentioned in this paper are marked in panels (c) and (d). The cyan regions correspond to optical and/or radio SNR candidates (Stupar & Parker 2011; Stupar et al. 2018).
Current usage metrics show cumulative count of Article Views (full-text article views including HTML views, PDF and ePub downloads, according to the available data) and Abstracts Views on Vision4Press platform.
Data correspond to usage on the plateform after 2015. The current usage metrics is available 48-96 hours after online publication and is updated daily on week days.
Initial download of the metrics may take a while.