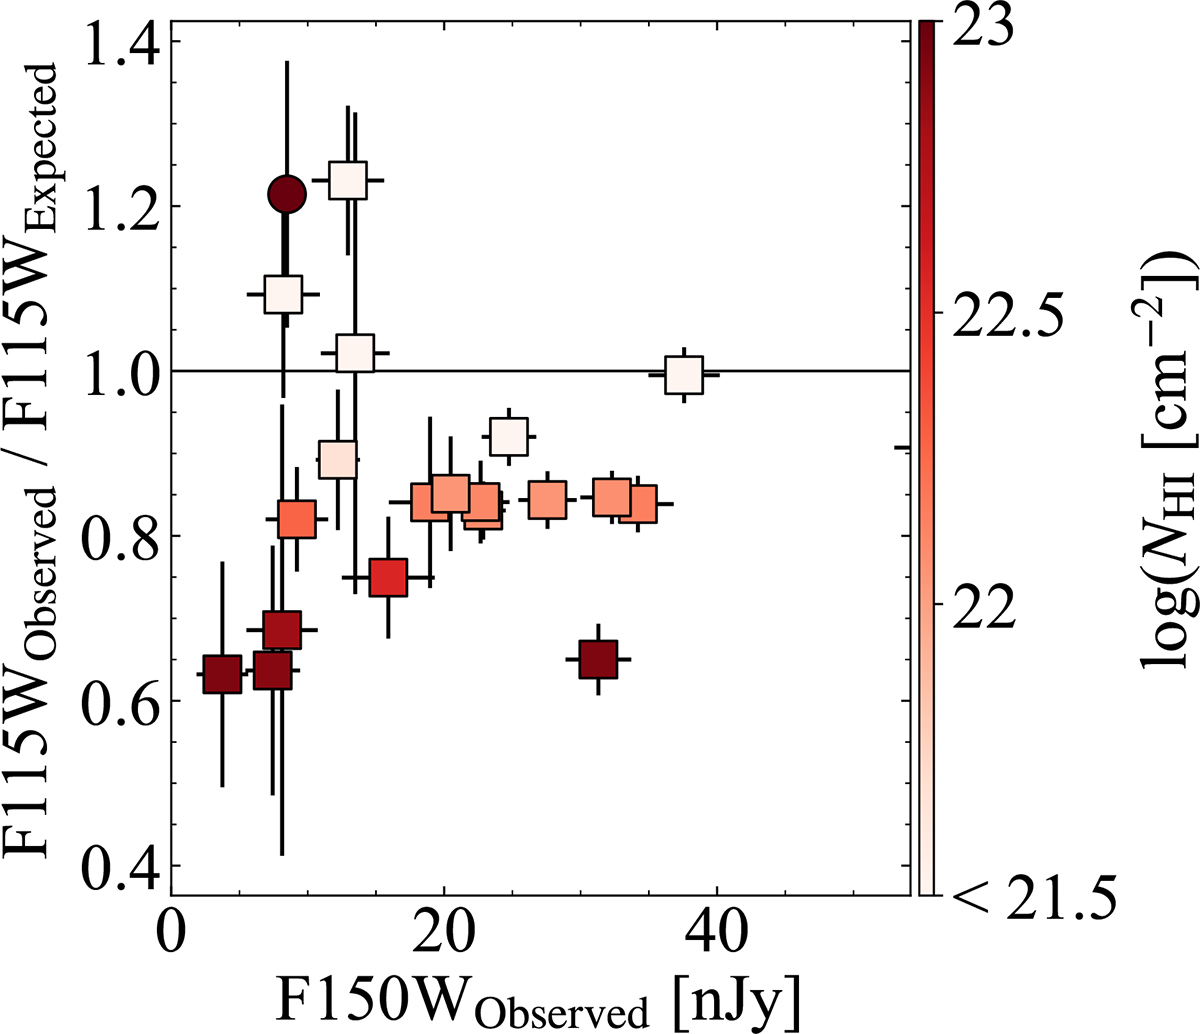
Fig. 5.
Download original image
Ratio of the flux observed in the F115W filter relative to the expected F115W from our PROSPECTOR SED fitting (described in Section 5). The data points are colour coded by the inferred neutral hydrogen column density, discussed in Section 5. We note here that the circular data point is simultaneously a strong LAE and DLA, and hence we utilise the spectroscopically measured NHI from Witten et al. (in prep.). The majority of galaxies show a strong suppression in the F115W filter that is best explained by high neutral hydrogen column densities (NHI > 1022 [cm−2]), which has been seen in the galaxies for which deep NIRSpec prism observations are available (Chen et al. 2024; Witten et al. 2025a; Mason et al. 2026).
Current usage metrics show cumulative count of Article Views (full-text article views including HTML views, PDF and ePub downloads, according to the available data) and Abstracts Views on Vision4Press platform.
Data correspond to usage on the plateform after 2015. The current usage metrics is available 48-96 hours after online publication and is updated daily on week days.
Initial download of the metrics may take a while.