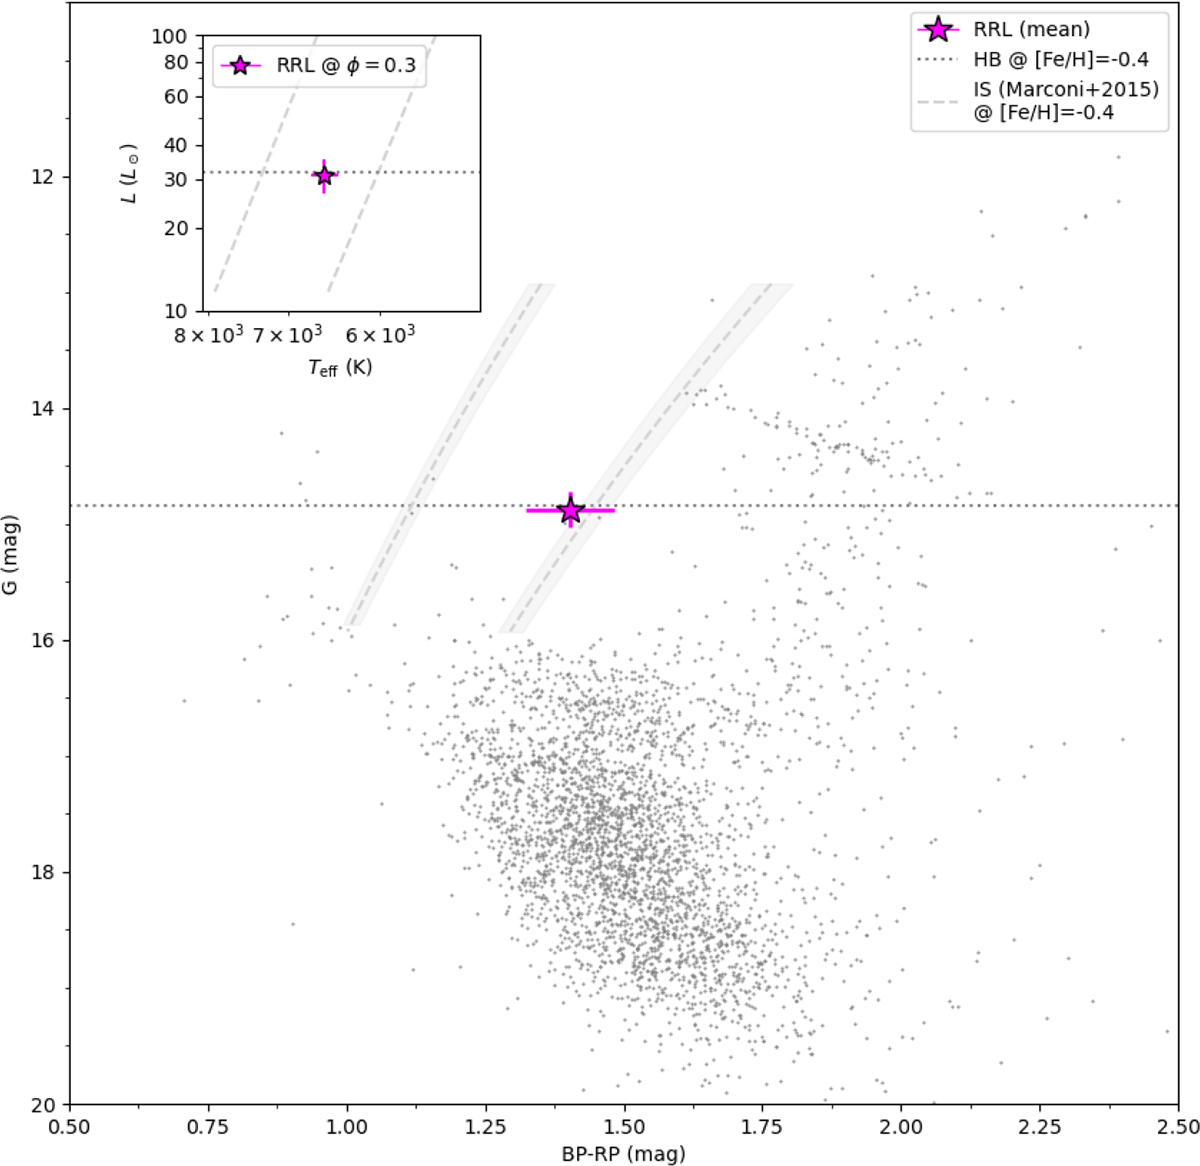
Fig. F.1.
Download original image
Color-magnitude diagram for the Trumpler 5 OC. The mean position (intensity-averaged magnitude and color) of the RRL is shown with the (magenta) star. Cluster members from Cantat-Gaudin et al. (2020) are shown as (gray) dots. The dashed and dotted lines correspond to the instability strip limits from Marconi et al. (2015) and horizontal branch magnitude from the Garofalo et al. (2022) period-luminosity-metallicity relation at the star’s metallicity, distance and extinction of AV = 1.65 ± 0.15 following M25 (see their Sec.3 for details). The insert shows the H-R diagram and the position of the star at ϕ = 0.3
Current usage metrics show cumulative count of Article Views (full-text article views including HTML views, PDF and ePub downloads, according to the available data) and Abstracts Views on Vision4Press platform.
Data correspond to usage on the plateform after 2015. The current usage metrics is available 48-96 hours after online publication and is updated daily on week days.
Initial download of the metrics may take a while.