Fig. E.1.
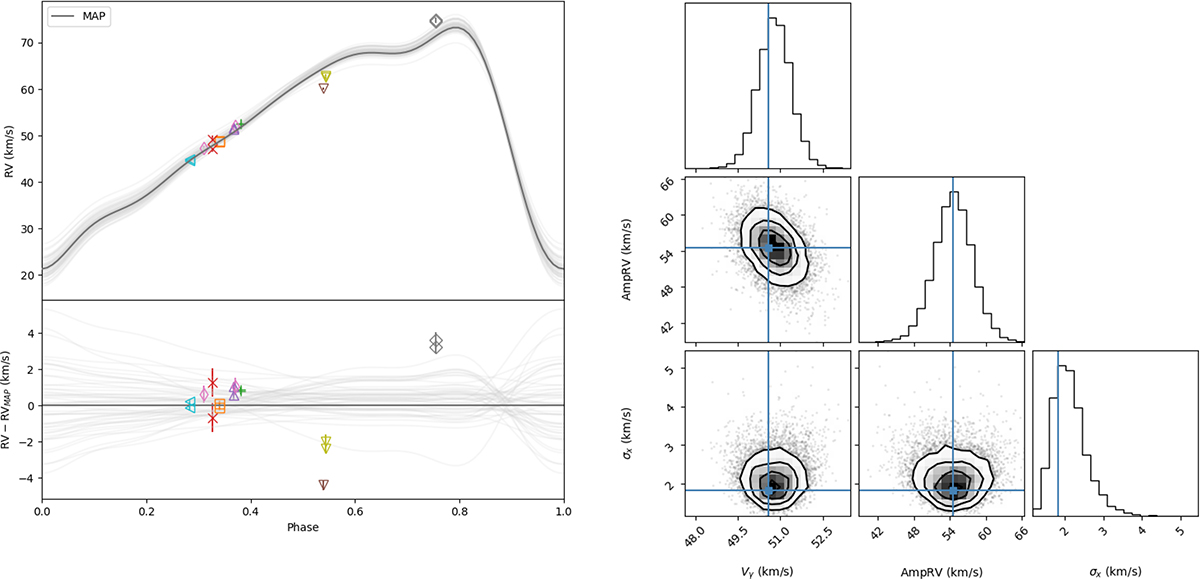
Download original image
Radial velocity (top) and best-fit residuals (bottom) as a function of phase. The best-fitting template (MAP) is shown by the dark solid line. Light gray lines correspond to 50 random draws from the posterior PDF. Different symbols correspond to different observation epochs, with the two observations corresponding to the spectra from the blue/red channels at the same epoch sharing the same symbol. Error bars for the RVs are shown, but are typically smaller than the symbols. Right panel: Corner plot showing the marginal 2-D and 1-D posterior PDFs for the three free parameters: systemic velocity Vγ, amplitude of the RV curve AmpRV and the additional velocity dispersion term σx. The solid (blue) line corresponds to the MAP of the (joint) 3D posterior PDF.
Current usage metrics show cumulative count of Article Views (full-text article views including HTML views, PDF and ePub downloads, according to the available data) and Abstracts Views on Vision4Press platform.
Data correspond to usage on the plateform after 2015. The current usage metrics is available 48-96 hours after online publication and is updated daily on week days.
Initial download of the metrics may take a while.