Fig. 6.
Download original image
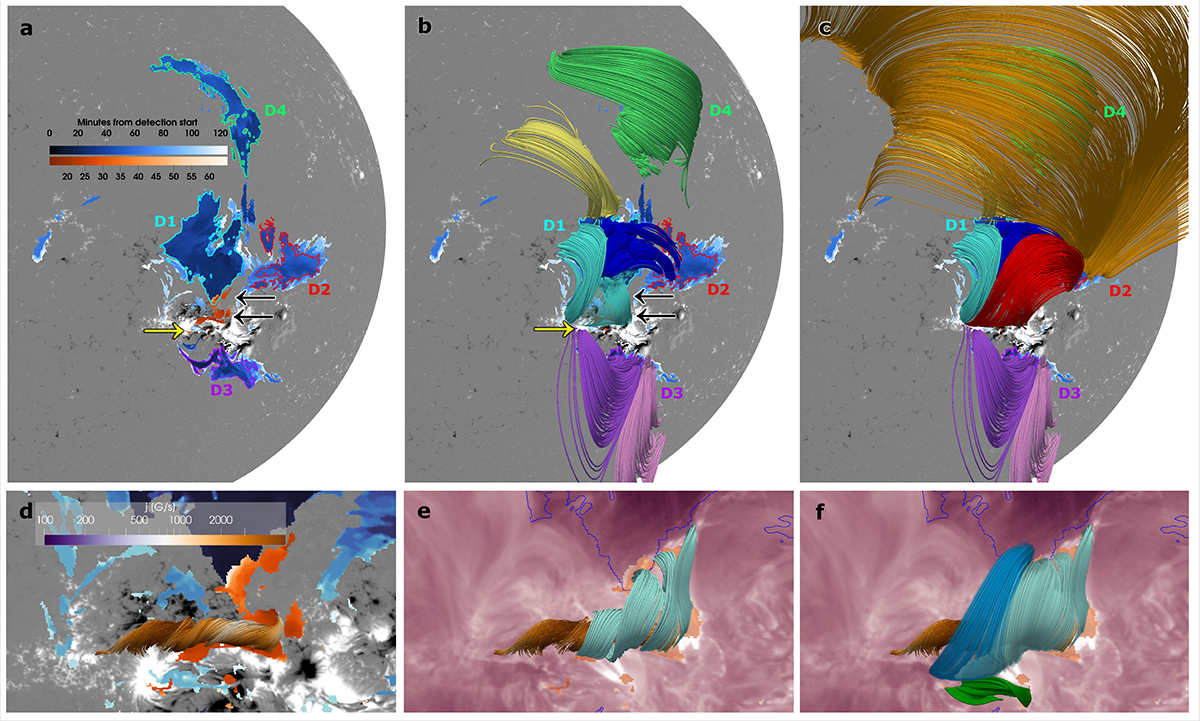
Same as Fig. 5 but for event no. 13. (a) Subregions of dimmings contoured in purple, red, cyan, and green and denoted as D1–D4. (b) and (c) Magnetic flux systems from the PFSS extrapolation from D1, D3, and D4 (panel b) and from all dimming regions (panel c). (d) and (f) Field lines sampled from NLFF extrapolations showing the flux rope (panel d, the colour indicates the local current density) and the field lines connected to the flare ribbons (panels e and f in cyan, blue and green).
Current usage metrics show cumulative count of Article Views (full-text article views including HTML views, PDF and ePub downloads, according to the available data) and Abstracts Views on Vision4Press platform.
Data correspond to usage on the plateform after 2015. The current usage metrics is available 48-96 hours after online publication and is updated daily on week days.
Initial download of the metrics may take a while.