Fig. 5.
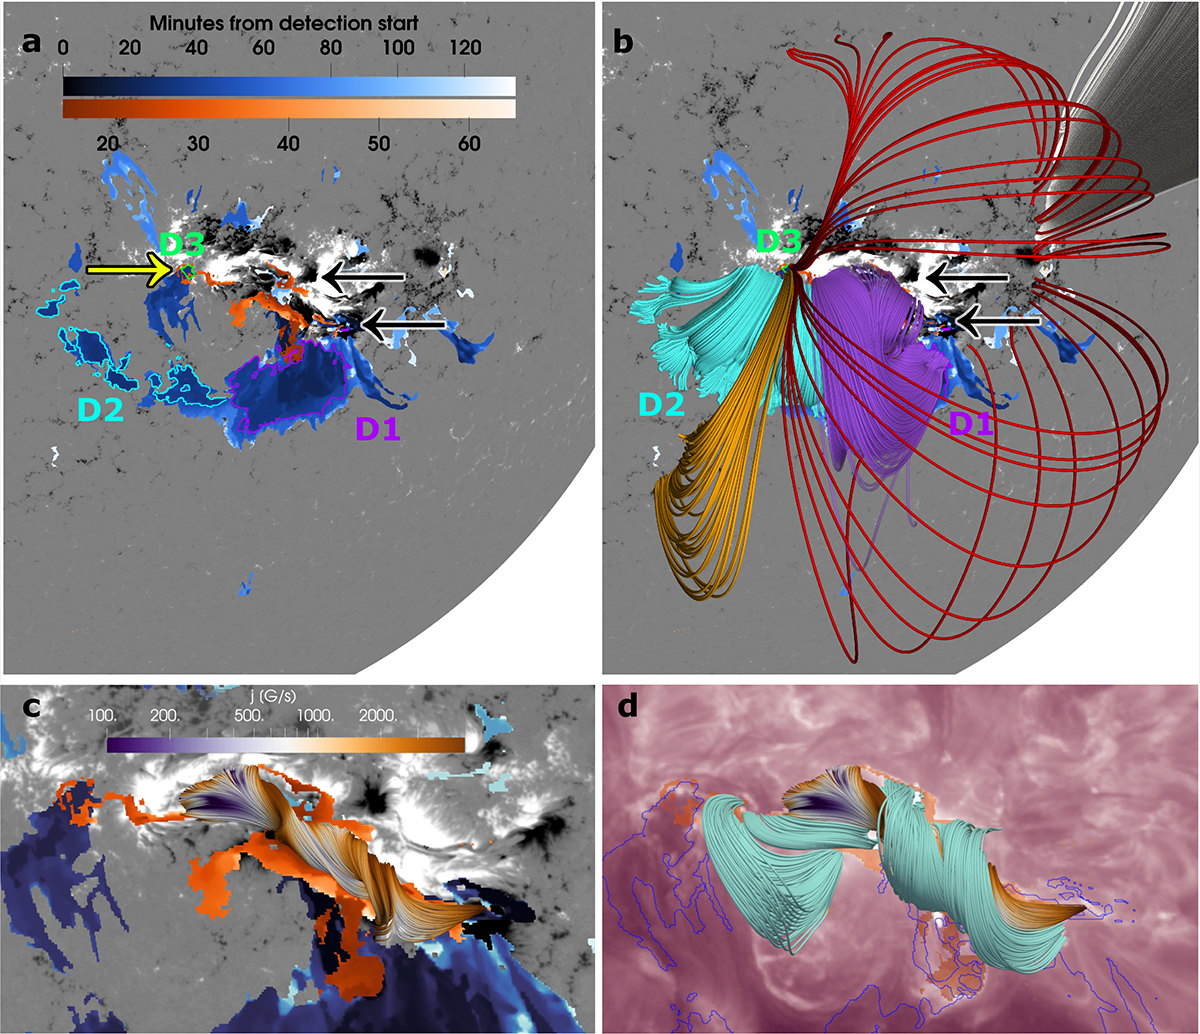
Download original image
Magnetic field structures rooted in the coronal dimmings of event no. 11 overlaid on an HMI radial magnetogram taken on May 9 at 08:36 UT. Coronal dimming regions are shaded in blue and flare ribbons in orange. Black and yellow arrows point to the flare ribbons. (a) Subregions of dimmings contoured in purple, cyan, and green and denoted as D1–D3. (b) All magnetic field structures from the PFSS extrapolation from D1 in purple, D2 in cyan, and D3 in orange and red. Grey field lines show open flux near the AR. (c) and (d) Field lines sampled from NLFF extrapolations showing the flux rope (panel a, colour refers to local current density) and the field lines connected to the flare ribbons (panel d, cyan).
Current usage metrics show cumulative count of Article Views (full-text article views including HTML views, PDF and ePub downloads, according to the available data) and Abstracts Views on Vision4Press platform.
Data correspond to usage on the plateform after 2015. The current usage metrics is available 48-96 hours after online publication and is updated daily on week days.
Initial download of the metrics may take a while.