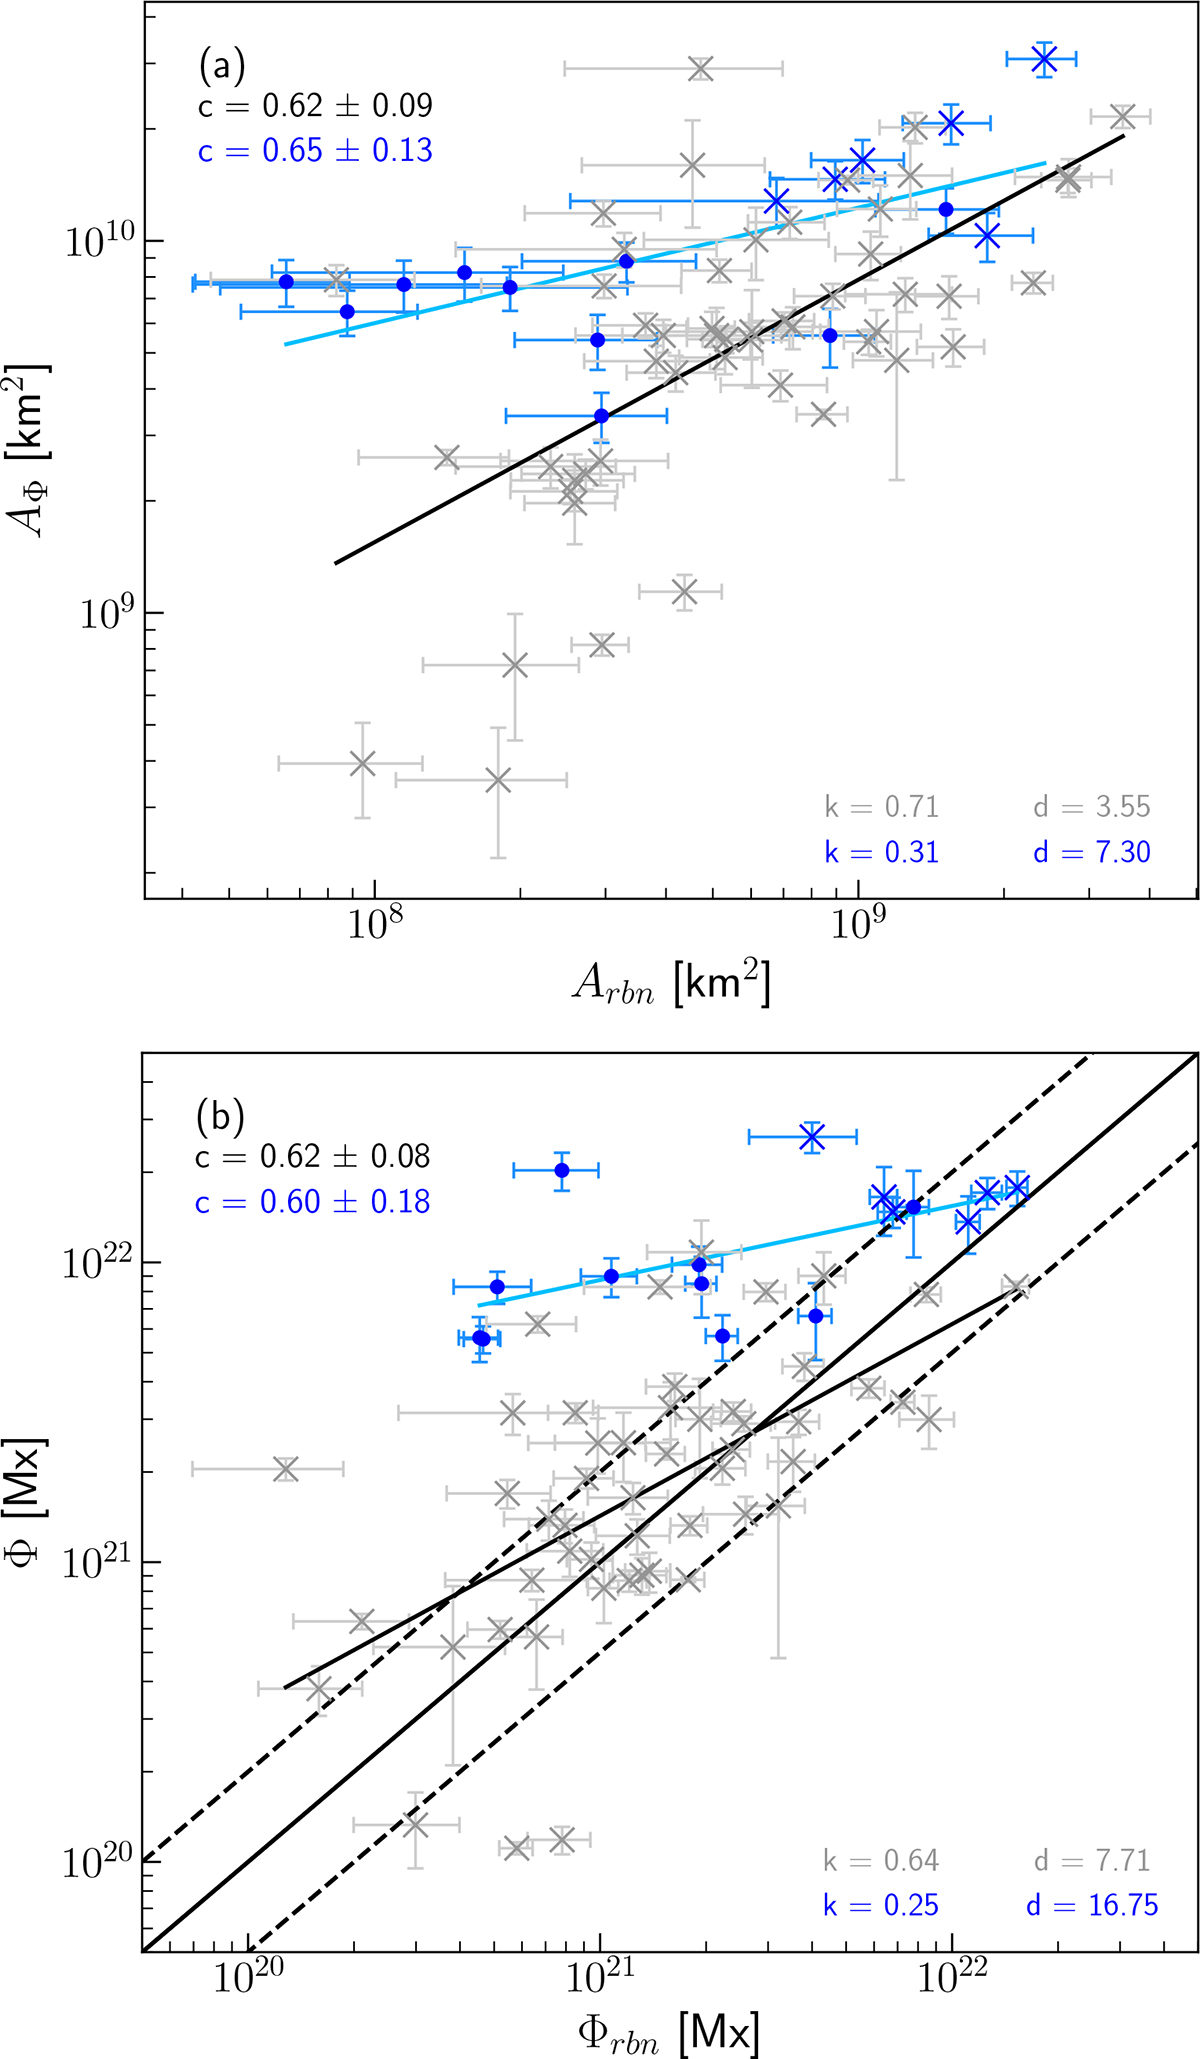
Fig. 2.
Download original image
(a) Comparison of the magnetic dimming area (Aϕ) against the flare ribbon area (Arbn). (b) Total unsigned magnetic dimming flux (ϕ) compared to the reconnection magnetic flux (ϕrbn). Blue markers represent dimmings from the May 2024 events (crosses mark X-class flares and dots M-class flares), while grey crosses correspond to dimming events from Dissauer et al. (2018a). The black (blue) regression lines were exclusively fitted to the grey (blue) data points.
Current usage metrics show cumulative count of Article Views (full-text article views including HTML views, PDF and ePub downloads, according to the available data) and Abstracts Views on Vision4Press platform.
Data correspond to usage on the plateform after 2015. The current usage metrics is available 48-96 hours after online publication and is updated daily on week days.
Initial download of the metrics may take a while.