Fig. A.1.
Download original image
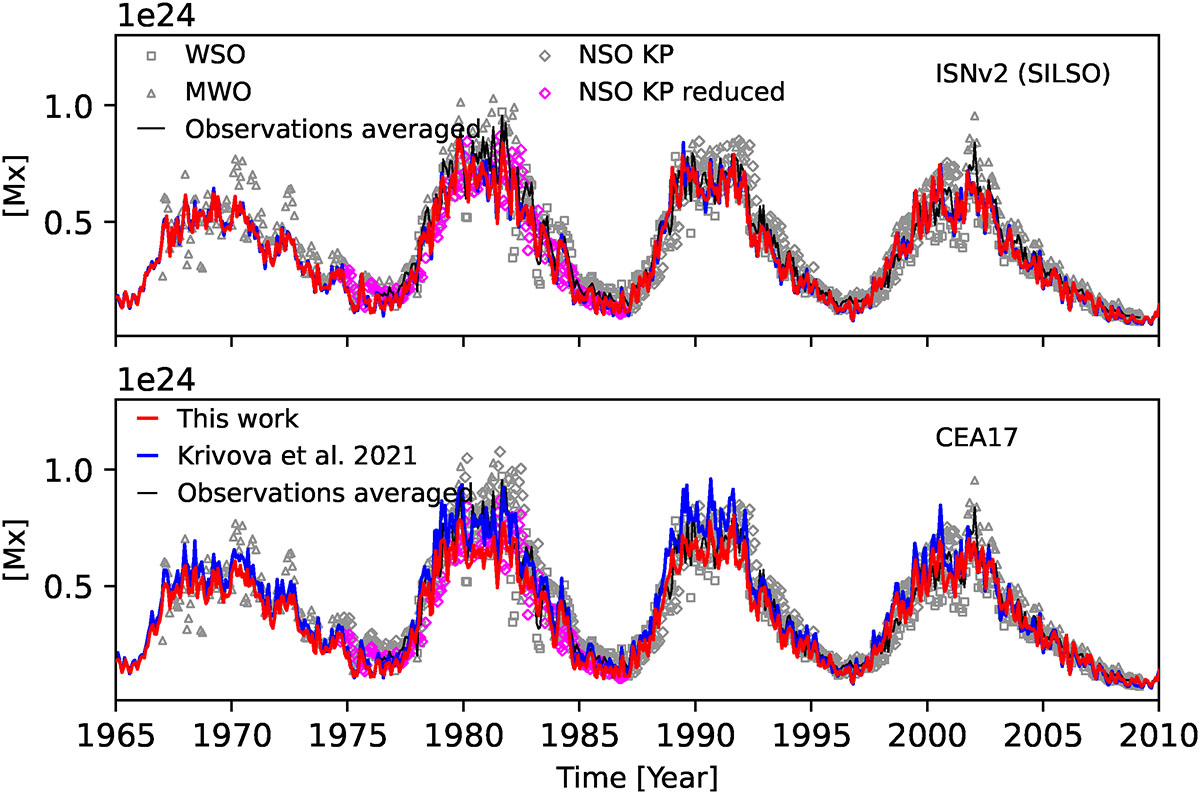
Same as Fig. 1, but here we reduced the NSO KP level in the period 1974–1987 to the level before the application of the Wenzler et al. (2006) calibration by dividing the 1974–1987 data by the factor 1.242. The black line shows the average over the magnetogram archives whenever at least two datasets are available. Using this ‘restored’ NSO/KP dataset, we obtain Pearson correlation coefficients of 0.95 (ISNv2) and 0.95 (CEA17), with RMD values of -7.69% and -7.75%, respectively. This suggests that the additional linear scaling applied by Wenzler et al. (2006) may not be appropriate for all magnetograms.
Current usage metrics show cumulative count of Article Views (full-text article views including HTML views, PDF and ePub downloads, according to the available data) and Abstracts Views on Vision4Press platform.
Data correspond to usage on the plateform after 2015. The current usage metrics is available 48-96 hours after online publication and is updated daily on week days.
Initial download of the metrics may take a while.