Fig. 8.
Download original image
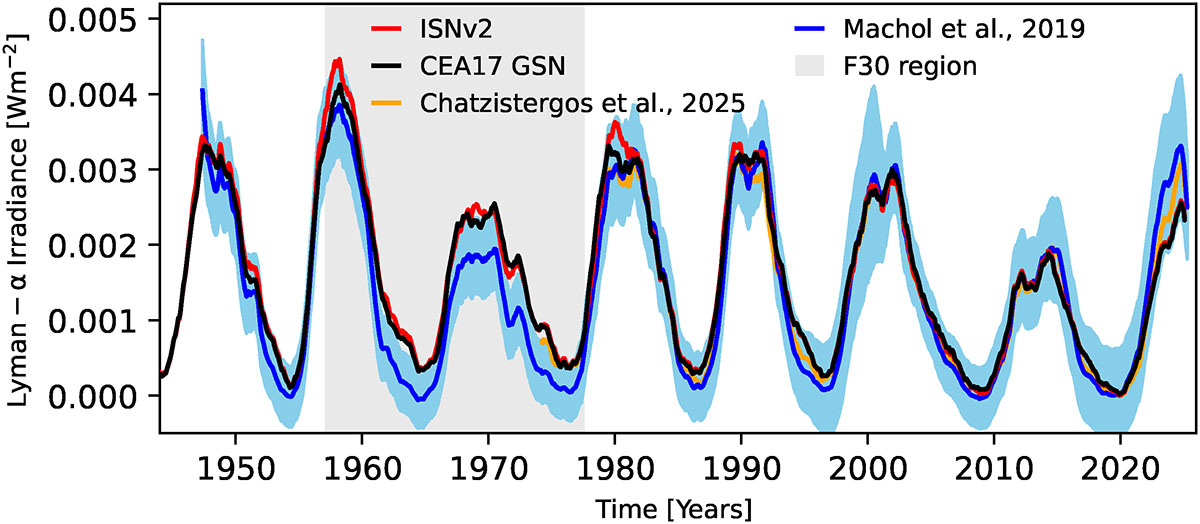
Reconstructed Lyman-α irradiance based on ISNv2 (red) and CEA17 (black) inputs. Also shown are the SATIRE-S Lyman-α reconstruction (Chatzistergos et al. 2025a, orange), and the observational composite by Machol et al. (2019, blue curve) with its uncertainties shown in light blue. The shaded grey area marks the period when the F30 data were used by Machol et al. (2019) instead of direct measurements. All series are shown as annual running means.
Current usage metrics show cumulative count of Article Views (full-text article views including HTML views, PDF and ePub downloads, according to the available data) and Abstracts Views on Vision4Press platform.
Data correspond to usage on the plateform after 2015. The current usage metrics is available 48-96 hours after online publication and is updated daily on week days.
Initial download of the metrics may take a while.