Fig. 7.
Download original image
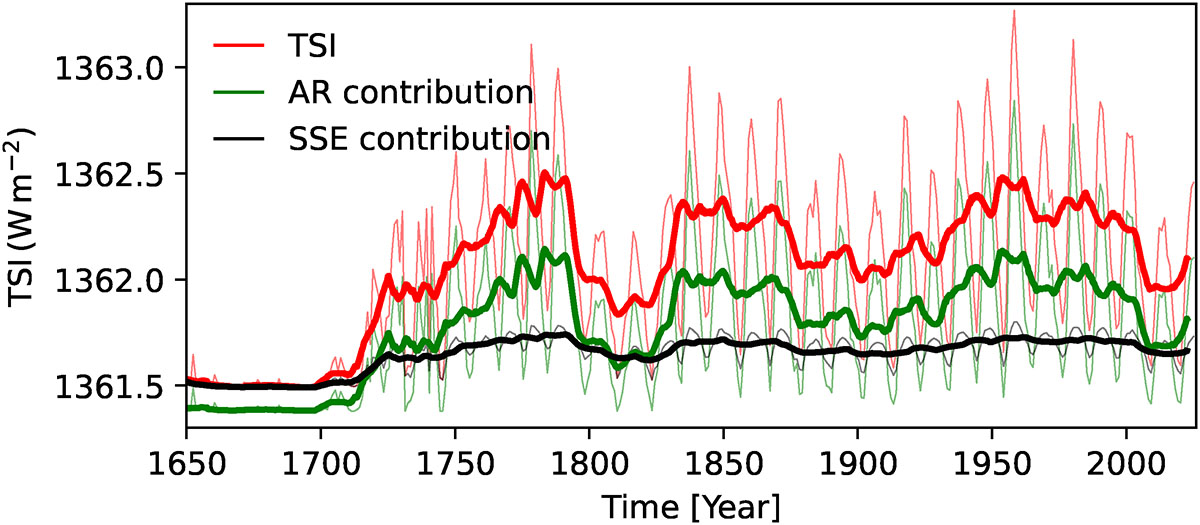
Total solar irradiance reconstruction based on ISNv2 as an input (red). The green and black curves show the contribution of different components of magnetic flux to TSI. Green shows the contribution of AR magnetic flux to TSI, and black shows the contribution of SSEs. Thin and thick lines show the annual means or 11-year running means, respectively.
Current usage metrics show cumulative count of Article Views (full-text article views including HTML views, PDF and ePub downloads, according to the available data) and Abstracts Views on Vision4Press platform.
Data correspond to usage on the plateform after 2015. The current usage metrics is available 48-96 hours after online publication and is updated daily on week days.
Initial download of the metrics may take a while.