Open Access
Fig. 6.
Download original image
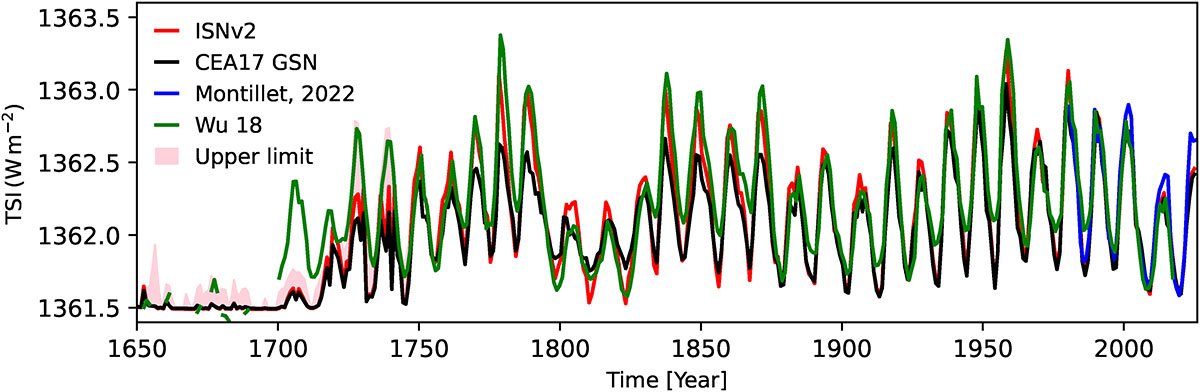
Reconstructed TSI (annual means) since 1700 using ISNv2 (red) and CEA17 GSN (black) as inputs. The shaded pink area shows our upper limit estimate in TSI, where the Carrasco et al. (2025) SNs were used. The TSI composite of Montillet et al. (2022) is shown in blue; the TSI reconstruction of Wu et al. (2018) in green.
Current usage metrics show cumulative count of Article Views (full-text article views including HTML views, PDF and ePub downloads, according to the available data) and Abstracts Views on Vision4Press platform.
Data correspond to usage on the plateform after 2015. The current usage metrics is available 48-96 hours after online publication and is updated daily on week days.
Initial download of the metrics may take a while.