Fig. 5.
Download original image
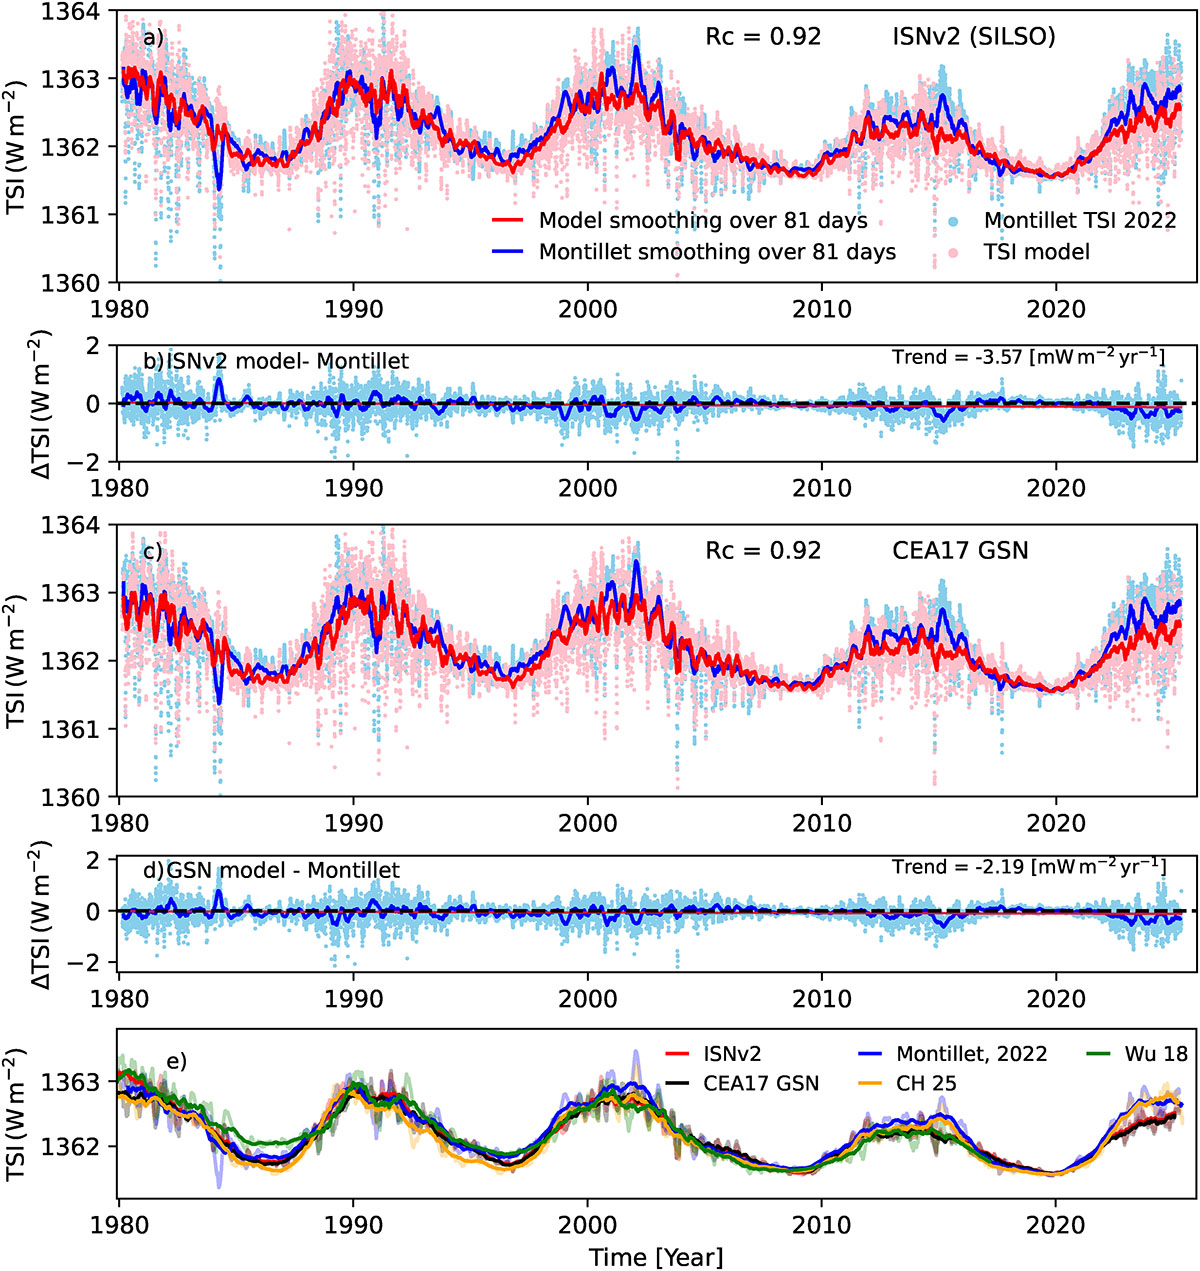
a) Reconstructed TSI using ISNv2 as input (pink: daily values; red: 81-day smoothing). Blue dots and blue line: TSI composite of Montillet et al. (2022, daily and 81-day smoothing, respectively). b) Difference between our reconstruction and the Montillet et al. (2022) composite (blue dots: daily; blue line: 81-day smoothing). The horizontal dashed black line marks zero, and the orange line is the linear fit to the daily residuals. c) and d) Same as a) and b), but using the CEA17 GSN as an input to the model. e) Our TSI reconstructions based on ISNv2 and CEA17 (red and black). For comparison, the Montillet et al. (blue 2022) composite, the TSI reconstruction of Wu et al. (green 2018), and that of Chatzistergos et al. (orange 2025a) are shown. All datasets in panel e) are shown as 81-day (faint lines) and annual moving means (solid lines).
Current usage metrics show cumulative count of Article Views (full-text article views including HTML views, PDF and ePub downloads, according to the available data) and Abstracts Views on Vision4Press platform.
Data correspond to usage on the plateform after 2015. The current usage metrics is available 48-96 hours after online publication and is updated daily on week days.
Initial download of the metrics may take a while.