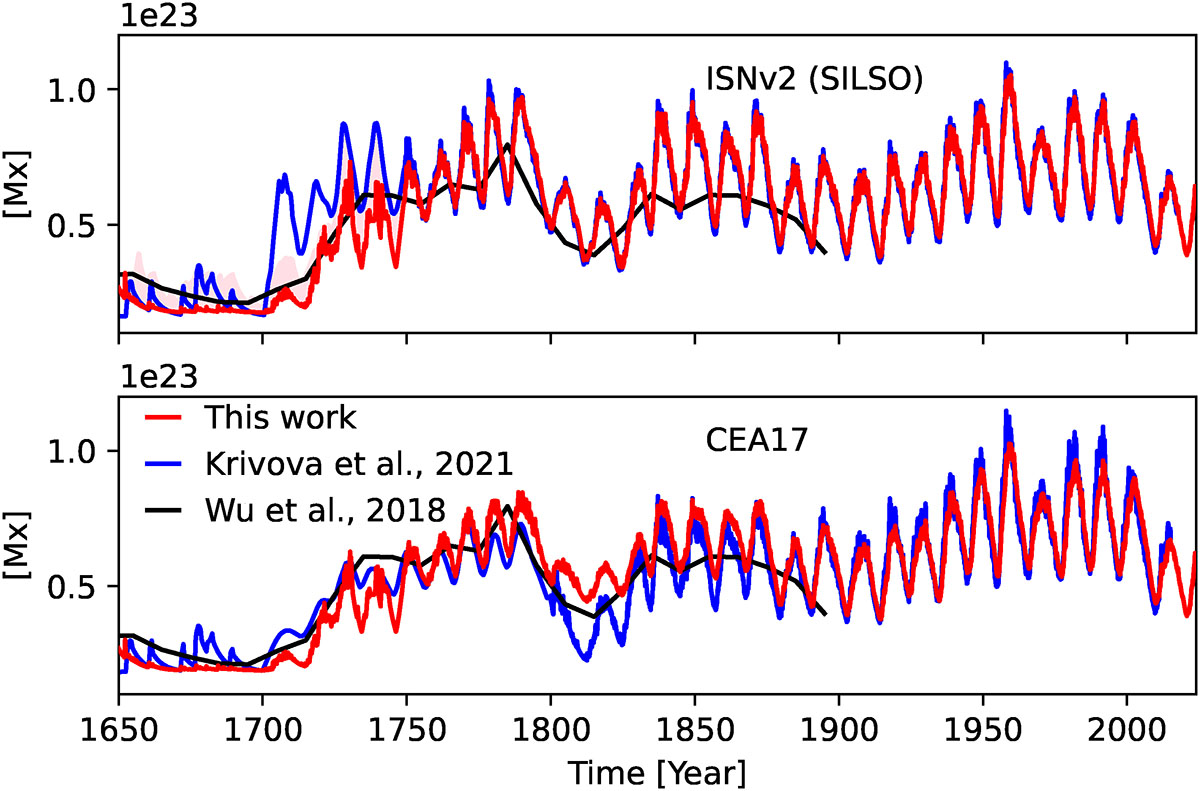
Fig. 4.
Download original image
OSF reconstruction from this study (red) and by Krivova et al. (2021, blue) using ISNv2 (top) and GSN (bottom; CEA17 here and HoSc98 in Krivova et al. 2021) as input. The shaded pink area shows our upper limit estimate for the Maunder minimum, where the SNs from Carrasco et al. (2025) was used as input. Black: OSF reconstructed from the cosmogenic isotope data by Wu et al. (2018).
Current usage metrics show cumulative count of Article Views (full-text article views including HTML views, PDF and ePub downloads, according to the available data) and Abstracts Views on Vision4Press platform.
Data correspond to usage on the plateform after 2015. The current usage metrics is available 48-96 hours after online publication and is updated daily on week days.
Initial download of the metrics may take a while.