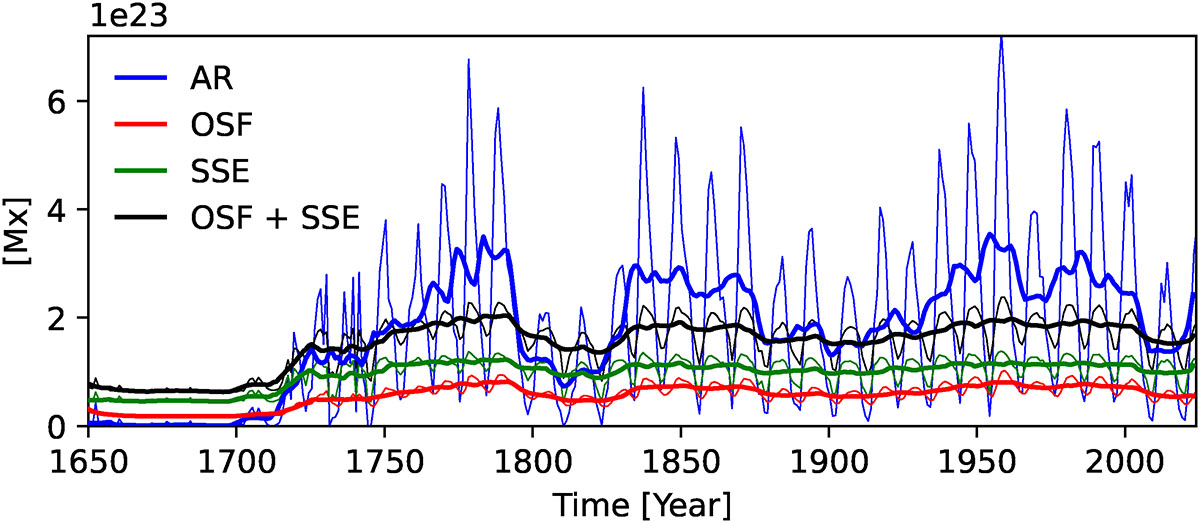
Fig. 2.
Download original image
Solar surface magnetic flux reconstruction based on ISNv2. Different components of surface magnetic flux are shown with different colours, both as 11-year moving averages and annual averages shown as thick and thin lines, respectively. Shown are the contributions from: active regions (ARs, blue), open solar flux (OSF, red), small-scale emergence regions (SSE, green), and the sum of OSF and SSE.
Current usage metrics show cumulative count of Article Views (full-text article views including HTML views, PDF and ePub downloads, according to the available data) and Abstracts Views on Vision4Press platform.
Data correspond to usage on the plateform after 2015. The current usage metrics is available 48-96 hours after online publication and is updated daily on week days.
Initial download of the metrics may take a while.