Fig. C.1
Download original image
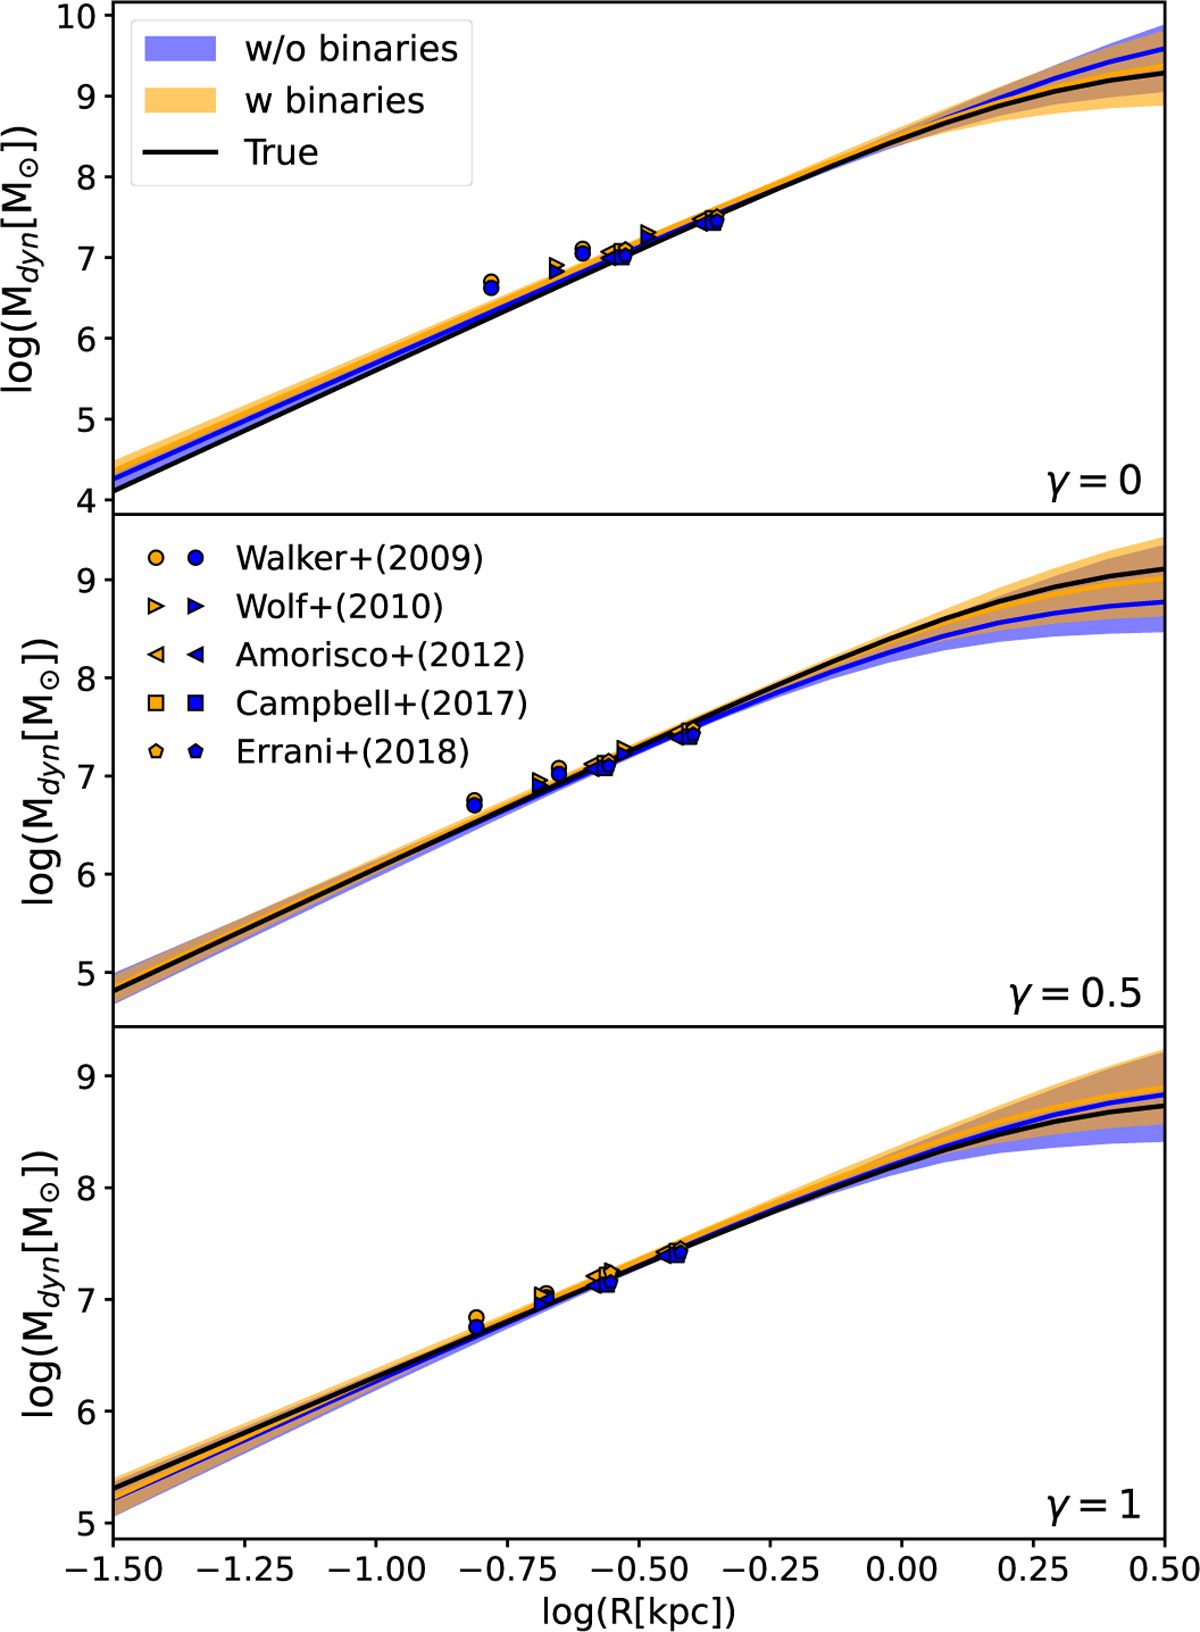
DM enclosed mass profiles for the three mock galaxies. From top to bottom they have γ = 0, 0.5, and 1. The black line shows the true DM density profile used to generate the mock; the blue line and band show the median and 1σ range for the output parameters of the modeling of the underlying mock; the orange line shows the same for the modeling of the mock contaminated by binaries. The symbols indicate the value estimated by mass estimators, applied to both populations, with the same color-coding.
Current usage metrics show cumulative count of Article Views (full-text article views including HTML views, PDF and ePub downloads, according to the available data) and Abstracts Views on Vision4Press platform.
Data correspond to usage on the plateform after 2015. The current usage metrics is available 48-96 hours after online publication and is updated daily on week days.
Initial download of the metrics may take a while.