Fig. 2
Download original image
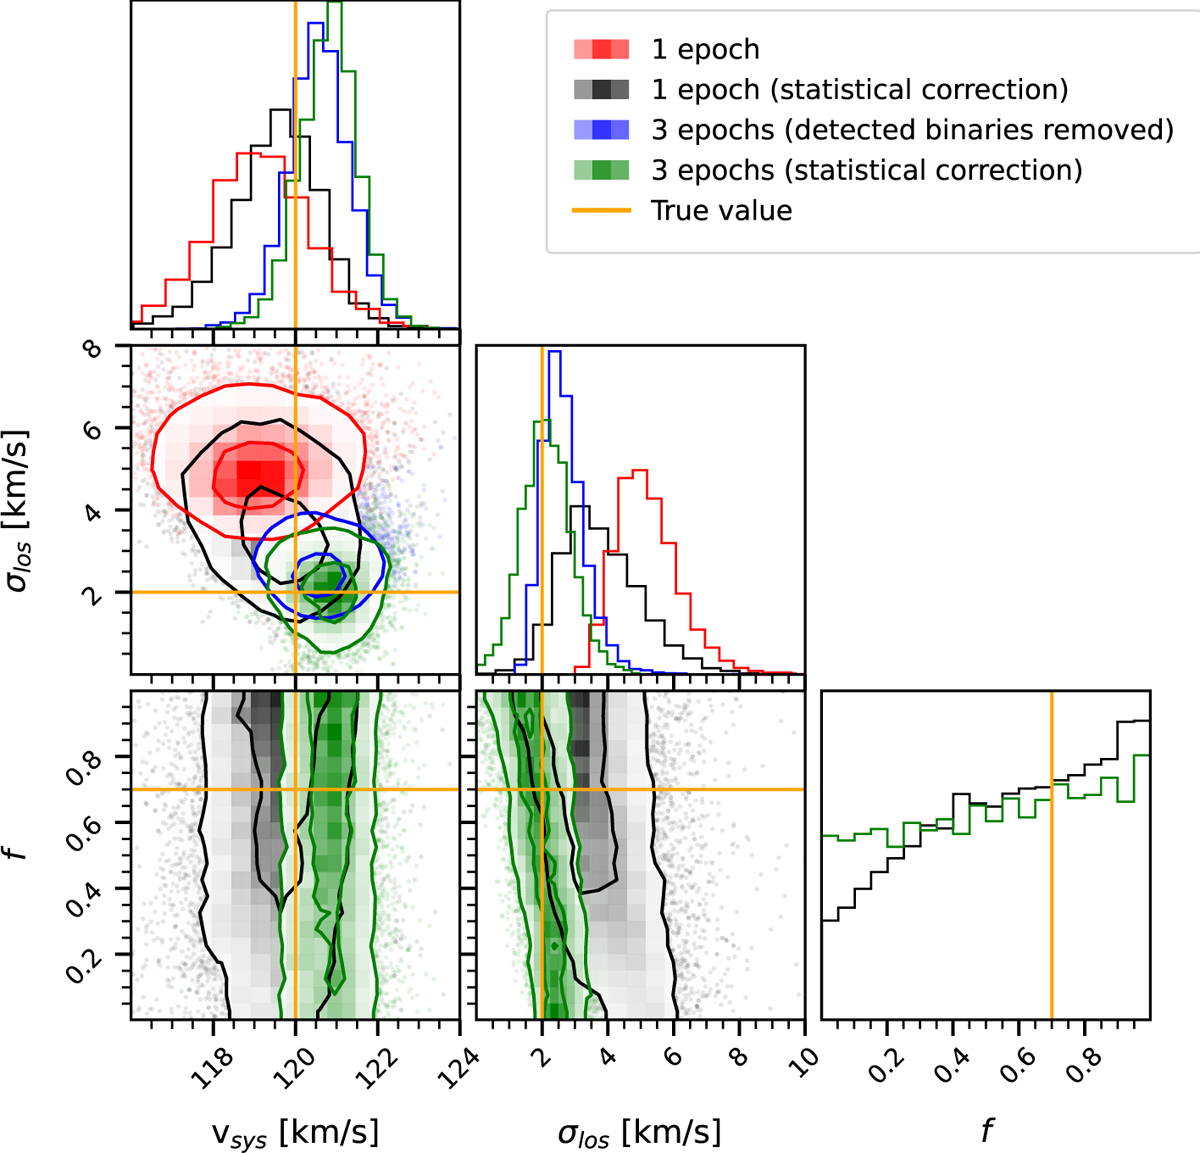
Corner plot showing the PPD on σlos, vsys and f for a mock catalog of 20 stars in two cases. Single-epoch observations (red: not correcting for binaries; black: applying a statistical correction for undetected binaries), and three-epoch observations (blue: by excluding stars with velocity variability >3× ∆vlos; green: as the blue, but also including a statistical correction for remaining undetected binaries). The contours indicate the 1 and 2σ ranges. The underlying values used to generate the mock are indicated with orange lines.
Current usage metrics show cumulative count of Article Views (full-text article views including HTML views, PDF and ePub downloads, according to the available data) and Abstracts Views on Vision4Press platform.
Data correspond to usage on the plateform after 2015. The current usage metrics is available 48-96 hours after online publication and is updated daily on week days.
Initial download of the metrics may take a while.