Fig. 1
Download original image
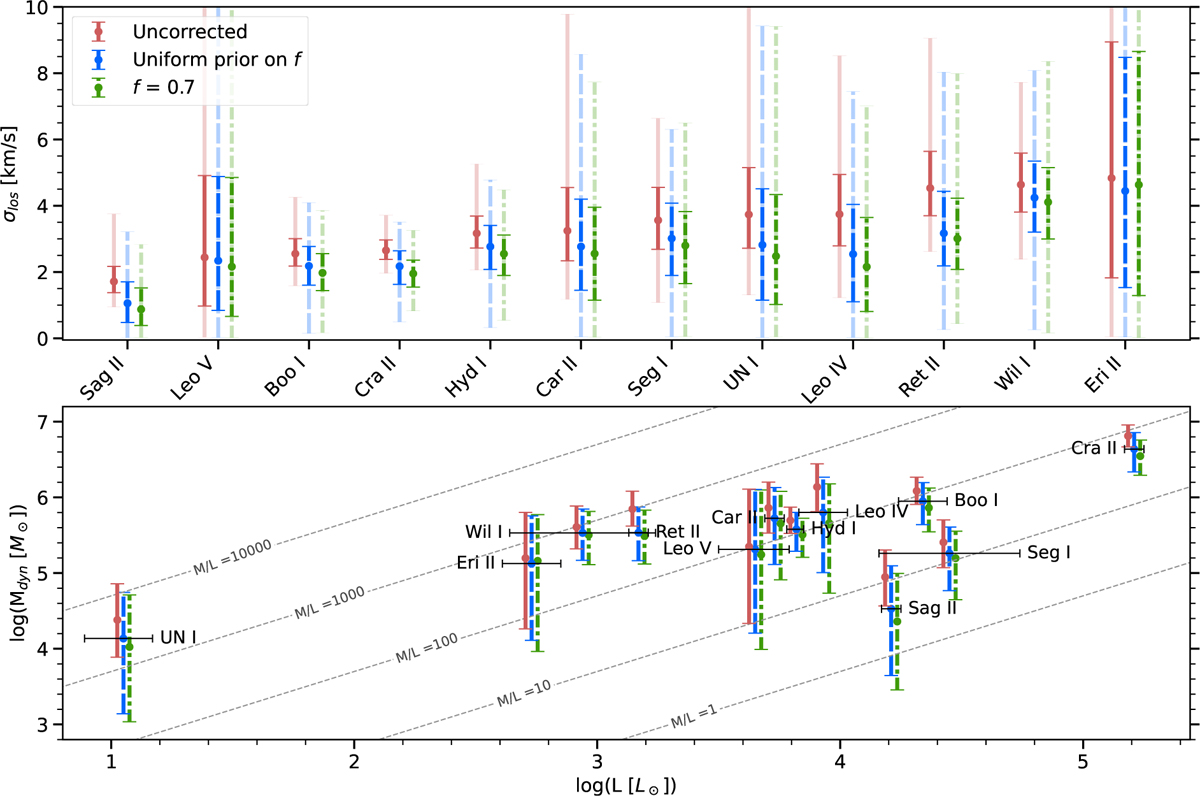
Observed σlos and estimated masses of UFDs. Upper panel: observed σlos for the UFDs analyzed in this work sorted by σlos,f=0. Lower panel: mass estimated with Eq. (3) versus the luminosity, both in log scale. The diagonal dashed gray lines indicate regions of constant M/L (= Mdyn(< r1/2)/(L/2)) in solar units indicated by the numbers. The horizontal black lines show the 1σ ranges for L. The red, blue, and green vertical lines indicate the median and 1σ ranges for the values uncorrected by binaries, corrected assuming a uniform prior on f and corrected assuming f = 0.7, respectively. The shaded lines in the upper panel indicate the 3σ range.
Current usage metrics show cumulative count of Article Views (full-text article views including HTML views, PDF and ePub downloads, according to the available data) and Abstracts Views on Vision4Press platform.
Data correspond to usage on the plateform after 2015. The current usage metrics is available 48-96 hours after online publication and is updated daily on week days.
Initial download of the metrics may take a while.