Open Access
Fig. A.1.
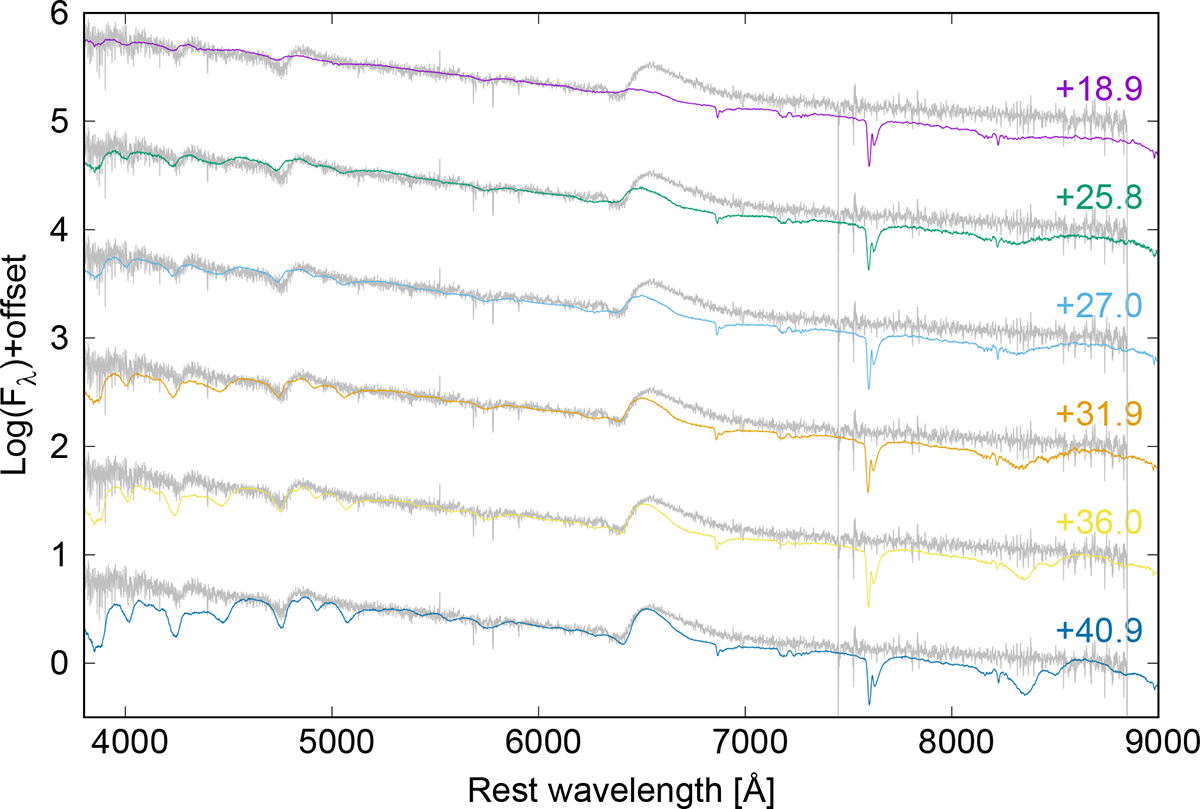
Download original image
Spectral comparison between SNe 2024qiw and 2023ixf. The early spectra of SN 2023ixf (colored lines) are overplotted on the earliest (Phase +27) spectrum of SN 2024qiw (gray). The phases are given relative to the explosion.
Current usage metrics show cumulative count of Article Views (full-text article views including HTML views, PDF and ePub downloads, according to the available data) and Abstracts Views on Vision4Press platform.
Data correspond to usage on the plateform after 2015. The current usage metrics is available 48-96 hours after online publication and is updated daily on week days.
Initial download of the metrics may take a while.