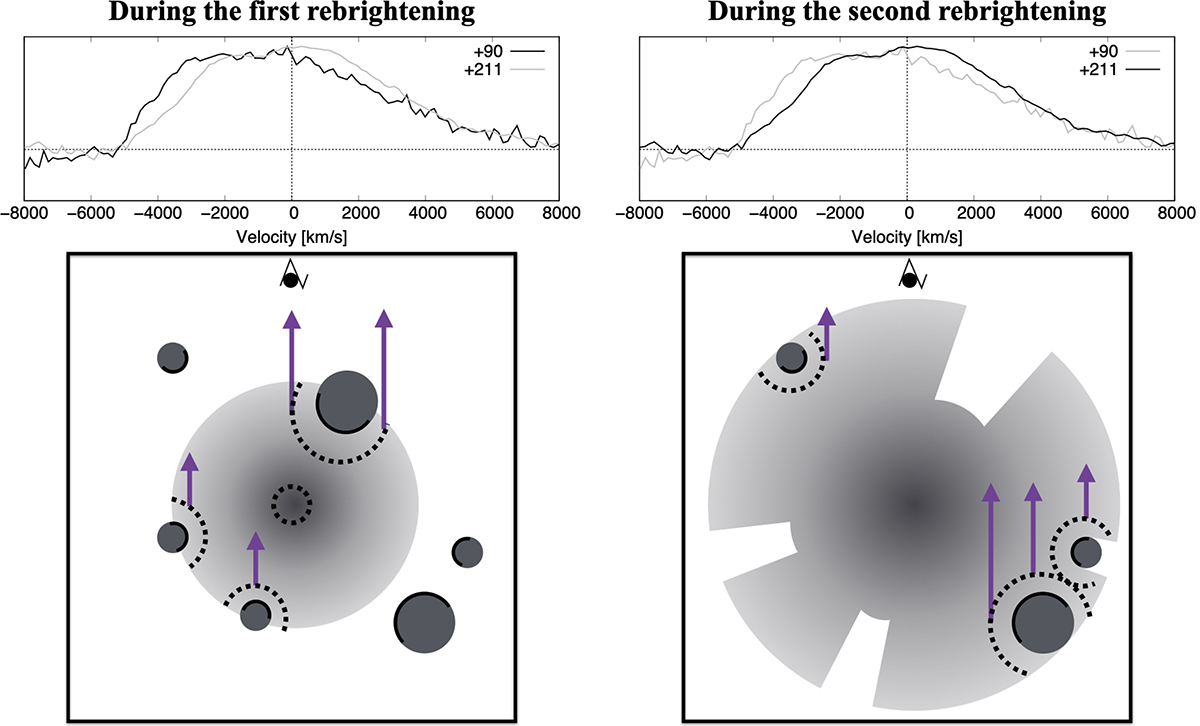
Fig. 3.
Download original image
Schematic illustration of our interpretation of the observational properties of SN 2024qiw. The left and right panels correspond to the first and second rebrightenings, respectively, with the system viewed from above each bottom panel. The enhancement of the −4000 km/s component in the Hα profile during the first rebrightening indicates interaction with a major CSM clump on the near side of the SN ejecta, while the enhancement of the +2000 km/s component during the second rebrightening suggests interaction with another major clump on the far side. The dotted lines show the locations of the local photospheres produced by the CSM-clump interaction.
Current usage metrics show cumulative count of Article Views (full-text article views including HTML views, PDF and ePub downloads, according to the available data) and Abstracts Views on Vision4Press platform.
Data correspond to usage on the plateform after 2015. The current usage metrics is available 48-96 hours after online publication and is updated daily on week days.
Initial download of the metrics may take a while.