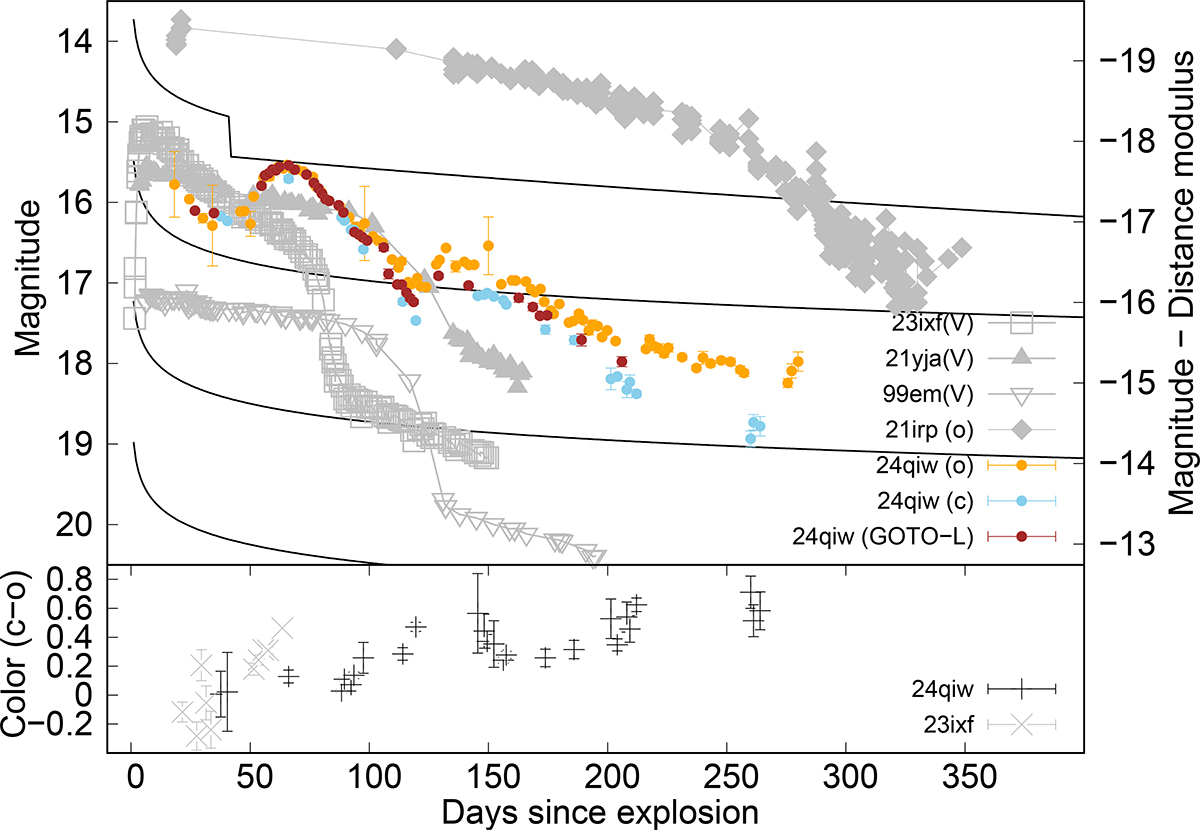
Fig. 1.
Download original image
Photometry of SN 2024qiw. Top: Optical LCs (colored points) compared with those of other SNe (gray points; plotted toward the right y-axis). The comparison data are from Singh et al. (2024), Anderson et al. (2014), Galbany et al. (2016), Nagao et al. (2024), Reynolds et al. (2025a). The black lines show V-band LCs from the CSM-interaction model of Moriya et al. (2013), assuming SN ejecta with n = 12, δ = 1, Mej = 10 M⊙, and Eej = 1051 erg, and a spherical CSM, with vw = 100 km s−1 and s = 2, and a convergent efficiency ϵ = 0.5. The lines correspond to mass-loss rates of 10−1 to 10−4 M⊙ yr−1 (top to bottom). Bottom: c–o evolution compared with SN 2023ixf.
Current usage metrics show cumulative count of Article Views (full-text article views including HTML views, PDF and ePub downloads, according to the available data) and Abstracts Views on Vision4Press platform.
Data correspond to usage on the plateform after 2015. The current usage metrics is available 48-96 hours after online publication and is updated daily on week days.
Initial download of the metrics may take a while.