Fig. 4
Download original image
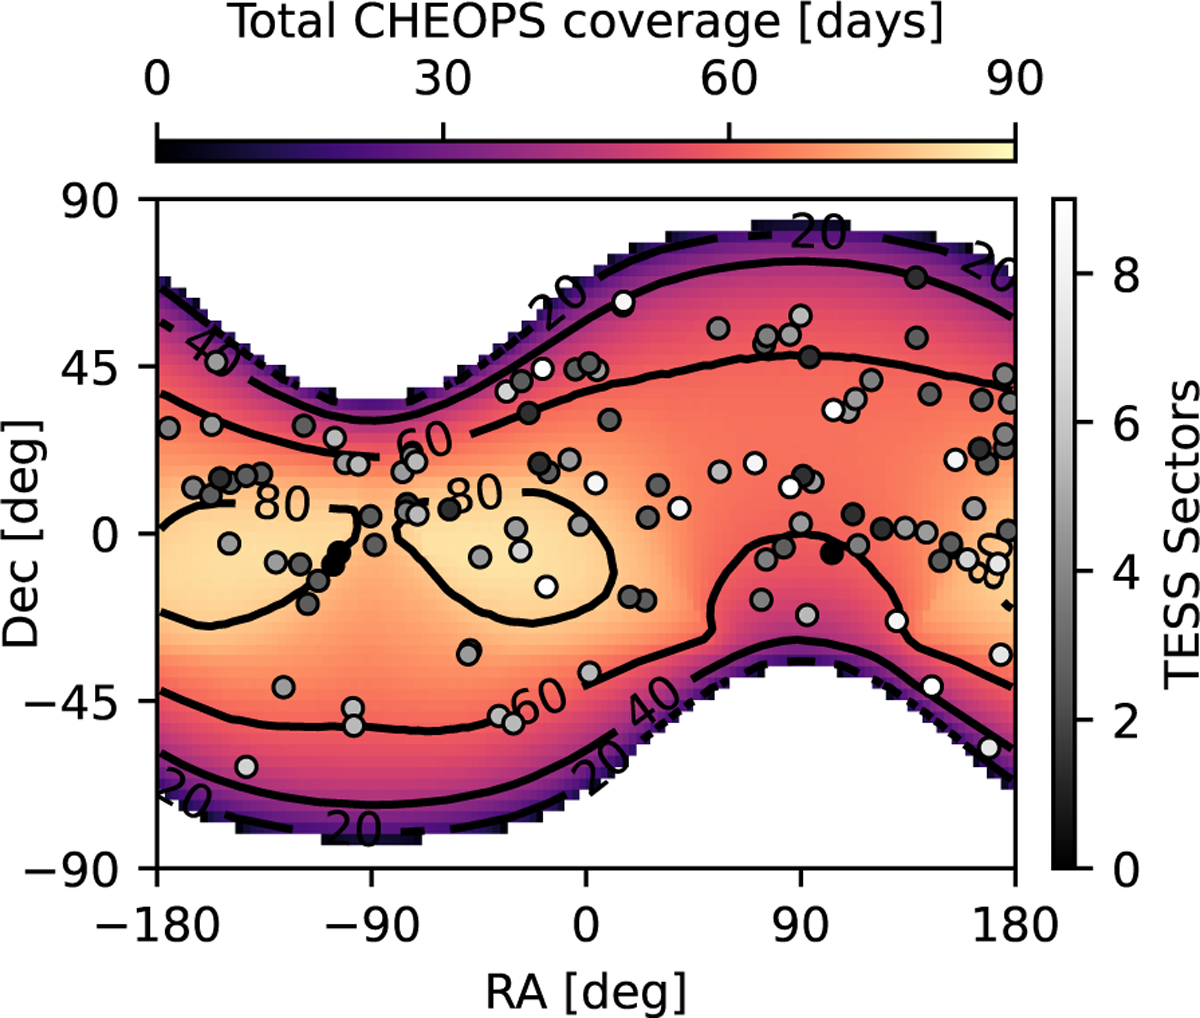
Coordinates of the target stars overlaid on the CHEOPS sky coverage map, with a minimum observing duration of 39 minutes per orbit, corresponding to ~40% efficiency. Circle colours show the number of TESS sectors covering each target. Background shading indicates total CHEOPS observing time in days per year, with black contours marking 20, 40, 60, and 80 days.
Current usage metrics show cumulative count of Article Views (full-text article views including HTML views, PDF and ePub downloads, according to the available data) and Abstracts Views on Vision4Press platform.
Data correspond to usage on the plateform after 2015. The current usage metrics is available 48-96 hours after online publication and is updated daily on week days.
Initial download of the metrics may take a while.