Open Access
Fig. C.3
Download original image
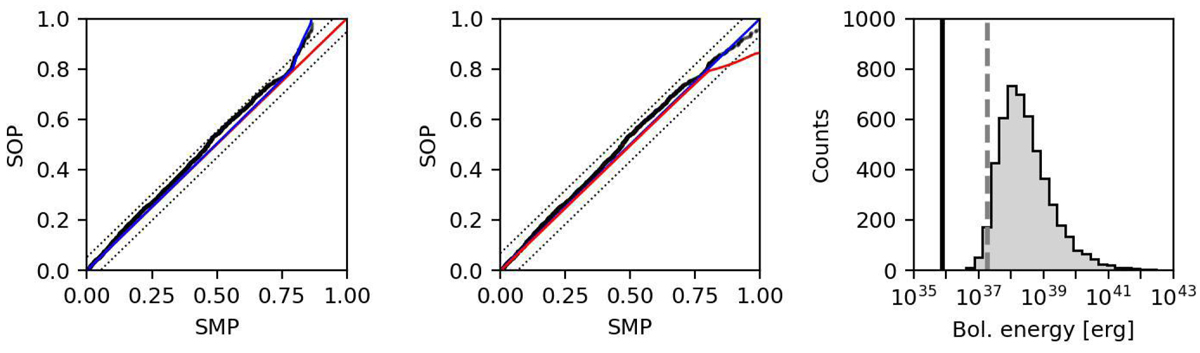
Same as Figures 13, but for the active subsample. In the left and middle panels, red and blue lines correspond to the best-fit infinite and truncated power laws, respectively. We observe a deviation from the infinite power law at high percentiles, which the exceedance test indicates is caused by limited sampling.
Current usage metrics show cumulative count of Article Views (full-text article views including HTML views, PDF and ePub downloads, according to the available data) and Abstracts Views on Vision4Press platform.
Data correspond to usage on the plateform after 2015. The current usage metrics is available 48-96 hours after online publication and is updated daily on week days.
Initial download of the metrics may take a while.