Fig. C.2
Download original image
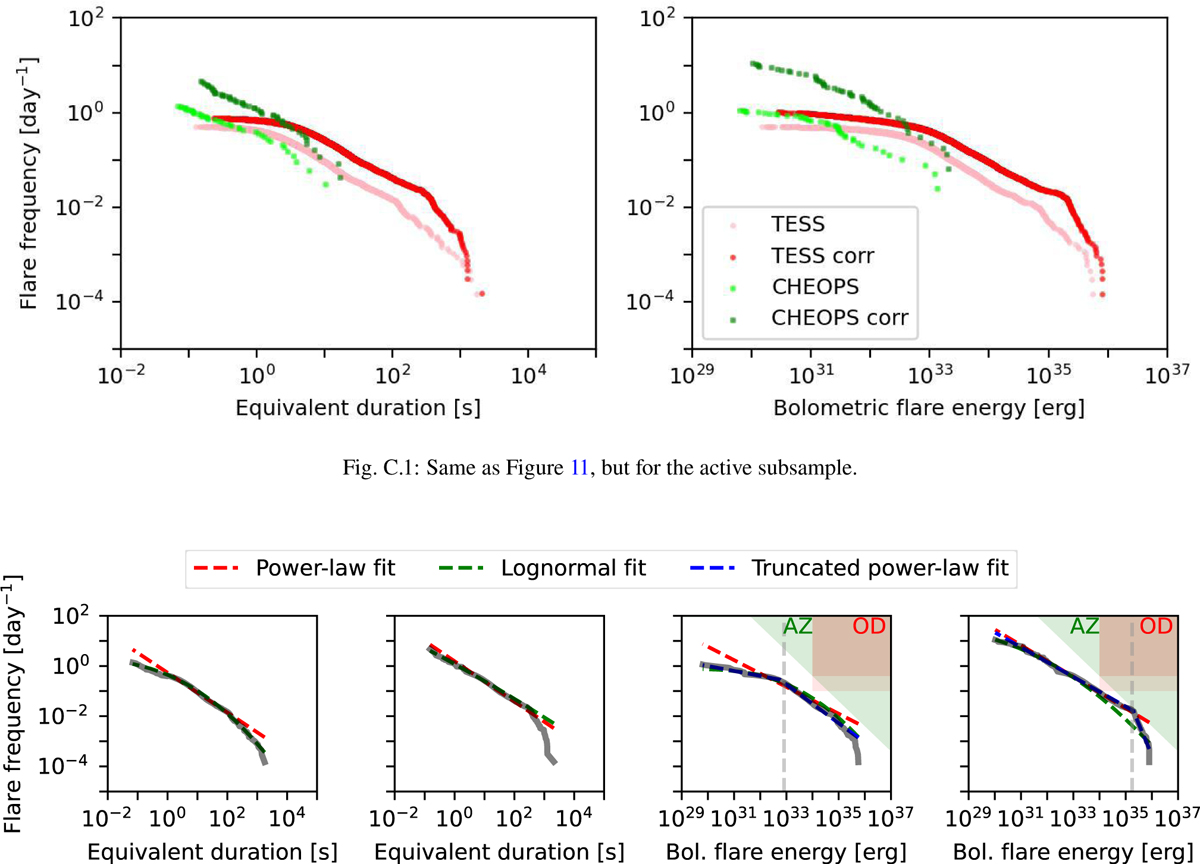
Same as Figure 12, but for the active subsample. We note a deviation from a power law at high EDs in both the observed (first panel) and corrected (second panel) distributions, which was not visible considering the full sample. We attribute this deviation to a sampling bias that becomes noticeable at high EDs when the number of targets is reduced. The uncorrected observational bias at low EDs in the observed distribution leads to a preference for a lognormal fit over a power law, representing the only difference from the conclusions drawn using the full sample. The obtained truncation thresholds obtained are t1 = 6.0 × 1032 and t2 = 2.0 × 1035 erg.
Current usage metrics show cumulative count of Article Views (full-text article views including HTML views, PDF and ePub downloads, according to the available data) and Abstracts Views on Vision4Press platform.
Data correspond to usage on the plateform after 2015. The current usage metrics is available 48-96 hours after online publication and is updated daily on week days.
Initial download of the metrics may take a while.