Fig. 12
Download original image
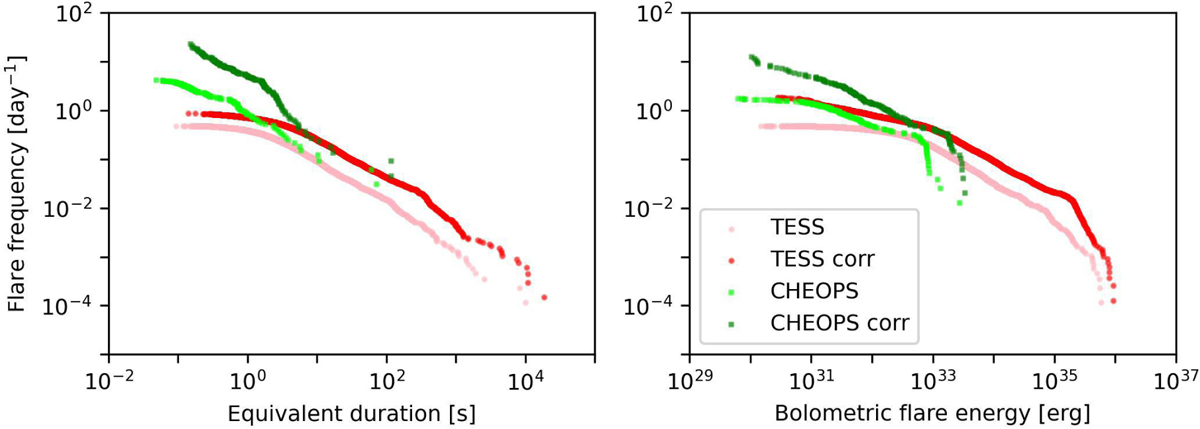
Combined FFDs (grey) for the observed (first and third panels) and corrected (second and fourth panels) samples. ED-based FFDs are shown in the first and second panels, and Ebol-based FFDs in the third and fourth panels. Power-law and lognormal fits are shown with dashed red and green lines, respectively, while truncated power-law fits for the Ebol-based FFDs are shown with dashed blue lines. The dashed vertical grey lines mark the truncation thresholds t1 and t2. The shaded green areas correspond to the abiogenesis zone (AZ) (Rimmer et al. 2018). The shaded light and dark red areas correspond to the permissive and conservative thresholds of the ozone depletion zone (OD) (Tilley et al. 2019), respectively.
Current usage metrics show cumulative count of Article Views (full-text article views including HTML views, PDF and ePub downloads, according to the available data) and Abstracts Views on Vision4Press platform.
Data correspond to usage on the plateform after 2015. The current usage metrics is available 48-96 hours after online publication and is updated daily on week days.
Initial download of the metrics may take a while.