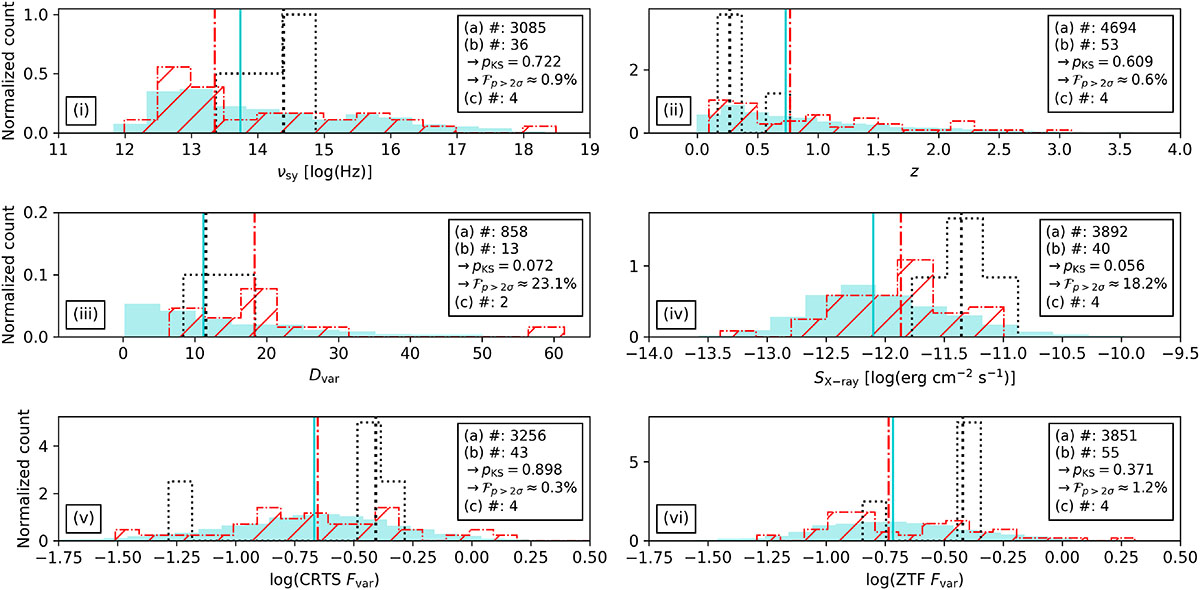
Fig. 7.
Download original image
Distribution of νsy (subplot i), z (subplot ii), Dvar (subplot iii), median SX-ray (subplot iv), CRTS Fvar (subplot v), and ZTF Fvar (subplot vi) of: (a) all blazars of the RFC† and 4LAC samples (with blue, solid lines); (b) blazars spatially associated with neutrinos having WT > 0.5 (with red, dash-dotted lines); and (c) blazars spatiotemporally associated with neutrinos via BB95 having WT > 0.5 (with black, dotted lines). “pKS” gives the p-value of the KS test, and “ℱp > 2σ” the fraction of resampled KS p-values reaching the 2σ threshold. “#” denotes the size of each sample.
Current usage metrics show cumulative count of Article Views (full-text article views including HTML views, PDF and ePub downloads, according to the available data) and Abstracts Views on Vision4Press platform.
Data correspond to usage on the plateform after 2015. The current usage metrics is available 48-96 hours after online publication and is updated daily on week days.
Initial download of the metrics may take a while.