Fig. 3.
Download original image
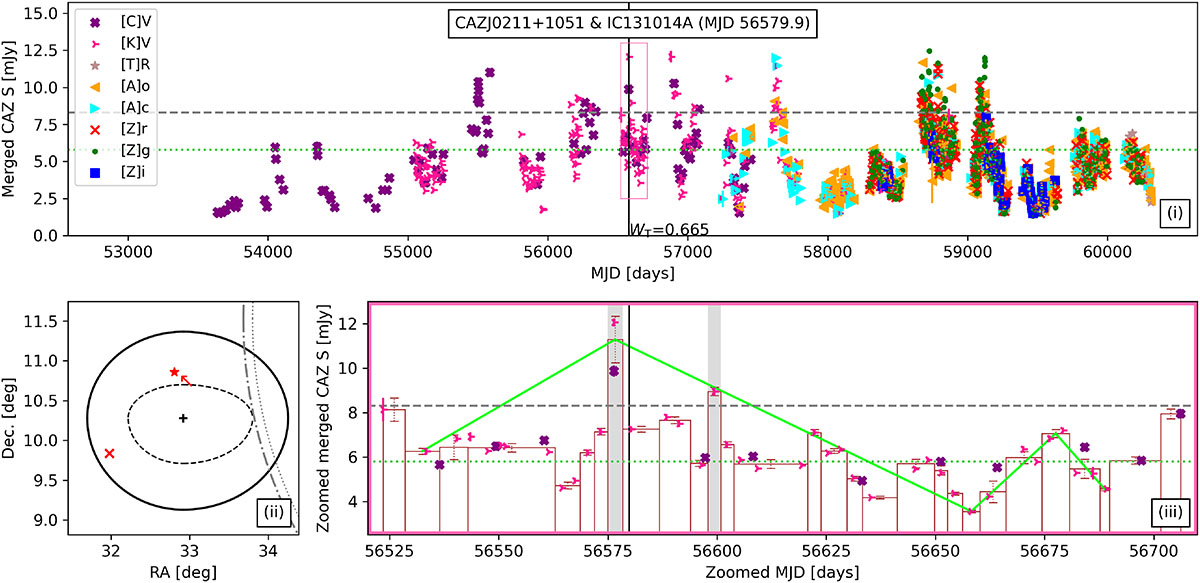
Light curve and sky map of the blazar CAZJ0211+1051, which is spatiotemporally associated with the neutrino IC131014A (WT = 0.665). Plot (i) shows the entire CAZ light curve of the blazar along with the arrival time of the associated neutrino (shown using a solid, vertical, black line). The horizontal dotted green line shows the 75th percentile flux density, and the horizontal dashed grey line the 95th percentile. In the plot legend, “[C]V” refers to the CRTS data points (obtained without filter), “[K]V” to the V-band of KAIT, “[T]R” to R-band of Tuorla, “[A]o” to o-filter of ATLAS, “[A]c” to c-filter of ATLAS, “[Z]r” to r-filter of ZTF, “[Z]g” to g-filter of ZTF, and “[Z]i” to i-filter of ZTF. Plot (ii) gives the sky map centered around the main associated neutrino, whose enlarged error region edge is drawn using a solid black line and its published error region using a dashed black line. All other neutrino events are plotted in grey (enlarged error regions using dash-dotted lines and published ones using dotted lines). The location of the main blazar within the main associated neutrino is shown with an arrow. Similar to Fig. 1, blazars which are only in RFC† are shown as circles, those only in 4LAC as crosses, and those in both RFC† and 4LAC as stars. Likewise, all blazars which are uncorrelated to the main associated neutrino are marked in faded blue, in orange if only spatially associated, in grey if spatiotemporally associated via BB95, in green if spatiotemporally associated via prominent BBHOP flares, and in red if via both BB95 periods and prominent BBHOP flares simultaneously (not to be confused with the BB95 at the peak of a BBHOP metric described in Sect. 2.2.6). CAZJ0211+1051 is 0.17° outside of the published error region of IC131014A. Plot (iii) shows a zoomed-in version of plot (i) around the arrival time of the associated neutrino. The zoom is demarcated in plot (i) using a pink box. The reddish brown solid lines in the background show the BB, the grey vertical bands show the BB95, and the green solid lines forming a wedge show the prominent BBHOP flares (connecting the start of the flare to its peak and subsequently to its end).
Current usage metrics show cumulative count of Article Views (full-text article views including HTML views, PDF and ePub downloads, according to the available data) and Abstracts Views on Vision4Press platform.
Data correspond to usage on the plateform after 2015. The current usage metrics is available 48-96 hours after online publication and is updated daily on week days.
Initial download of the metrics may take a while.