Fig. 2.
Download original image
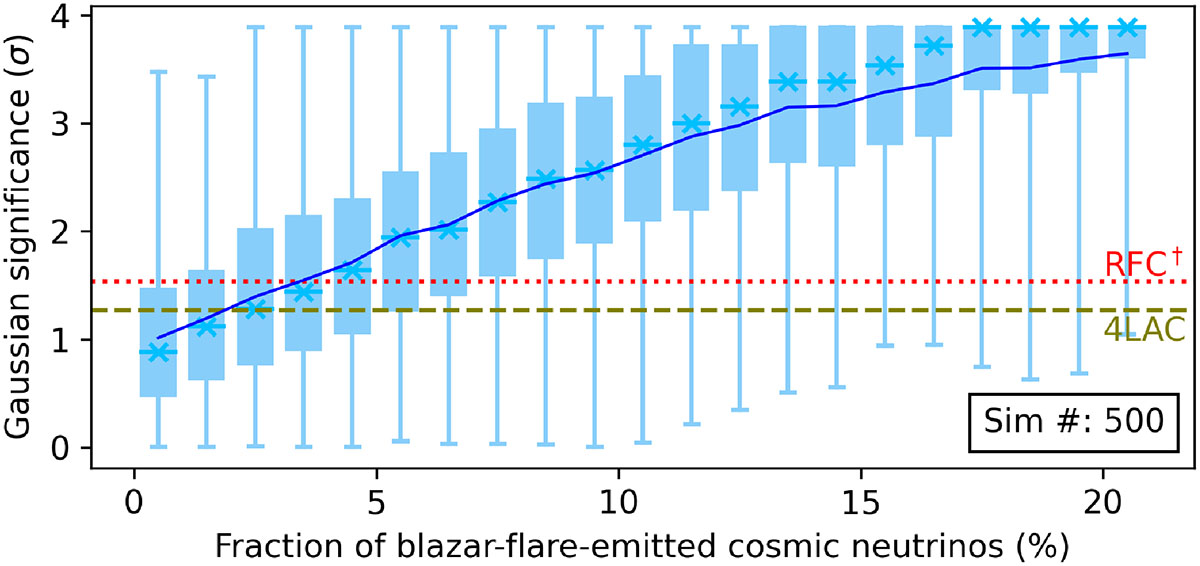
Spatiotemporal correlation significance in Gaussian σ against fraction of blazar-flare-emitted cosmic neutrinos from the updated IceCat1+ sample in %. The blue box plots represent the distribution of the significances for 500 simulations. The running solid (dark blue) line denotes the mean of the significances. The median is shown using a blue cross in the middle of the boxes, while the boxes themselves stretch from the 25th to 75th percentiles. The lines extended out of the boxes show the minimum and maximum significances obtained globally. The dotted red and the dashed olive horizontal lines show the correlation significances between the updated IceCat1+ neutrinos and all blazars of the RFC† and 4LAC samples, respectively, via the BB95 temporal metric (see Sect. 4.4). The significance in each simulation is limited to a maximum of 3.9σ (i.e., p = 0.0001). In these simulations we used a light curve gap fraction of 50%.
Current usage metrics show cumulative count of Article Views (full-text article views including HTML views, PDF and ePub downloads, according to the available data) and Abstracts Views on Vision4Press platform.
Data correspond to usage on the plateform after 2015. The current usage metrics is available 48-96 hours after online publication and is updated daily on week days.
Initial download of the metrics may take a while.