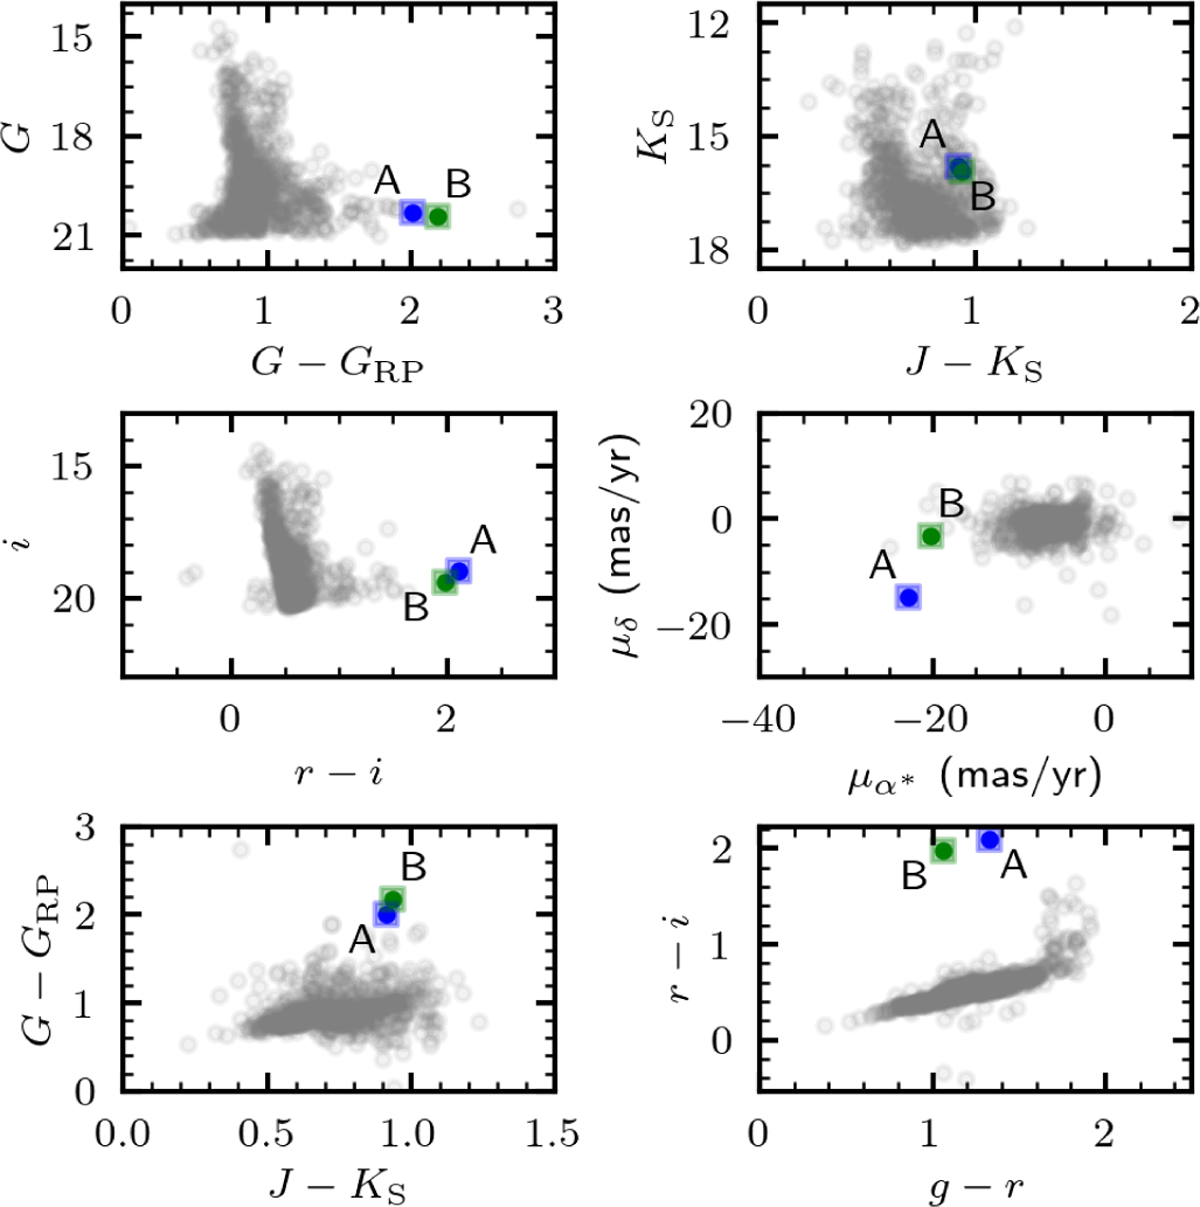
Fig. 8
Download original image
Top panels: observed CMDs from Gaia and VVVX (from left to right) for the 2′ field region surrounding VVVX-FFP-001. The primary (A) and secondary (B) binary components are indicated. Middle panels: from left to right, the DECaPS CMD and Gaia vector PM diagram. Bottom panels: Gaia-VVVX optical-near-IR color-color diagram, and DECaPS optical color-color diagram for the same region.
Current usage metrics show cumulative count of Article Views (full-text article views including HTML views, PDF and ePub downloads, according to the available data) and Abstracts Views on Vision4Press platform.
Data correspond to usage on the plateform after 2015. The current usage metrics is available 48-96 hours after online publication and is updated daily on week days.
Initial download of the metrics may take a while.