Open Access
Fig. 7
Download original image
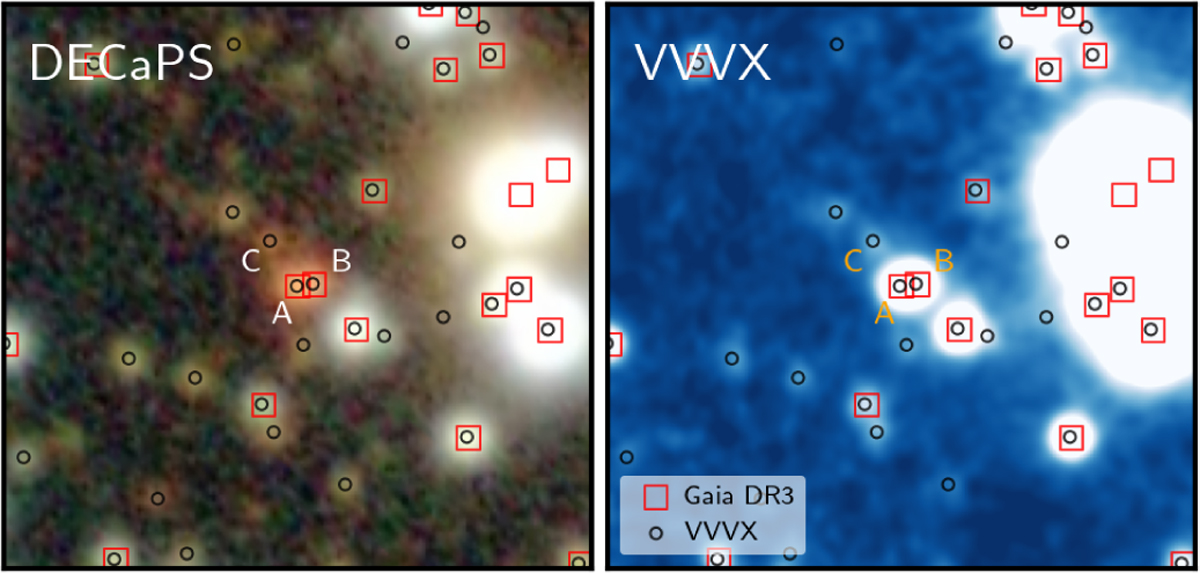
Left panel: optical finding chart for VVVX-FFP-001, that is the double source located at the center of the images. These images are 25" on a side, with north on top and east to the left. Right panel: map of the matched sources from the VVVX (blue squares) and Gaia DR3 (red circles) catalogs.
Current usage metrics show cumulative count of Article Views (full-text article views including HTML views, PDF and ePub downloads, according to the available data) and Abstracts Views on Vision4Press platform.
Data correspond to usage on the plateform after 2015. The current usage metrics is available 48-96 hours after online publication and is updated daily on week days.
Initial download of the metrics may take a while.