Fig. 4
Download original image
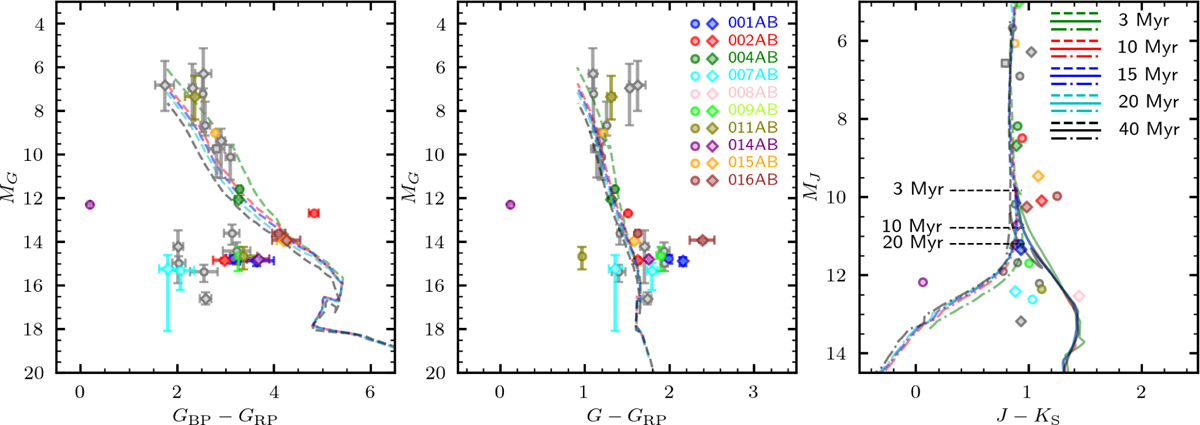
Absolute CMDs in the optical and near-IR for all the sources in the sample. Colored circles and diamonds with error bars represent the A and B components, respectively, for each pair for which the parallax difference is consistent within parallax errors, while gray error bars represent systems with discrepant parallaxes. In all panels, dashed lines represent the Baraffe et al. (2015) isochrones. In the right-most panel, the solid and dot-dashed lines represent the cloudy and clear atmosphere models of Saumon & Marley (2008), respectively. The three marks at 3, 10, and 20 Myr represent the limit of 13 MJup for the associated isochrones.
Current usage metrics show cumulative count of Article Views (full-text article views including HTML views, PDF and ePub downloads, according to the available data) and Abstracts Views on Vision4Press platform.
Data correspond to usage on the plateform after 2015. The current usage metrics is available 48-96 hours after online publication and is updated daily on week days.
Initial download of the metrics may take a while.