Fig. 3
Download original image
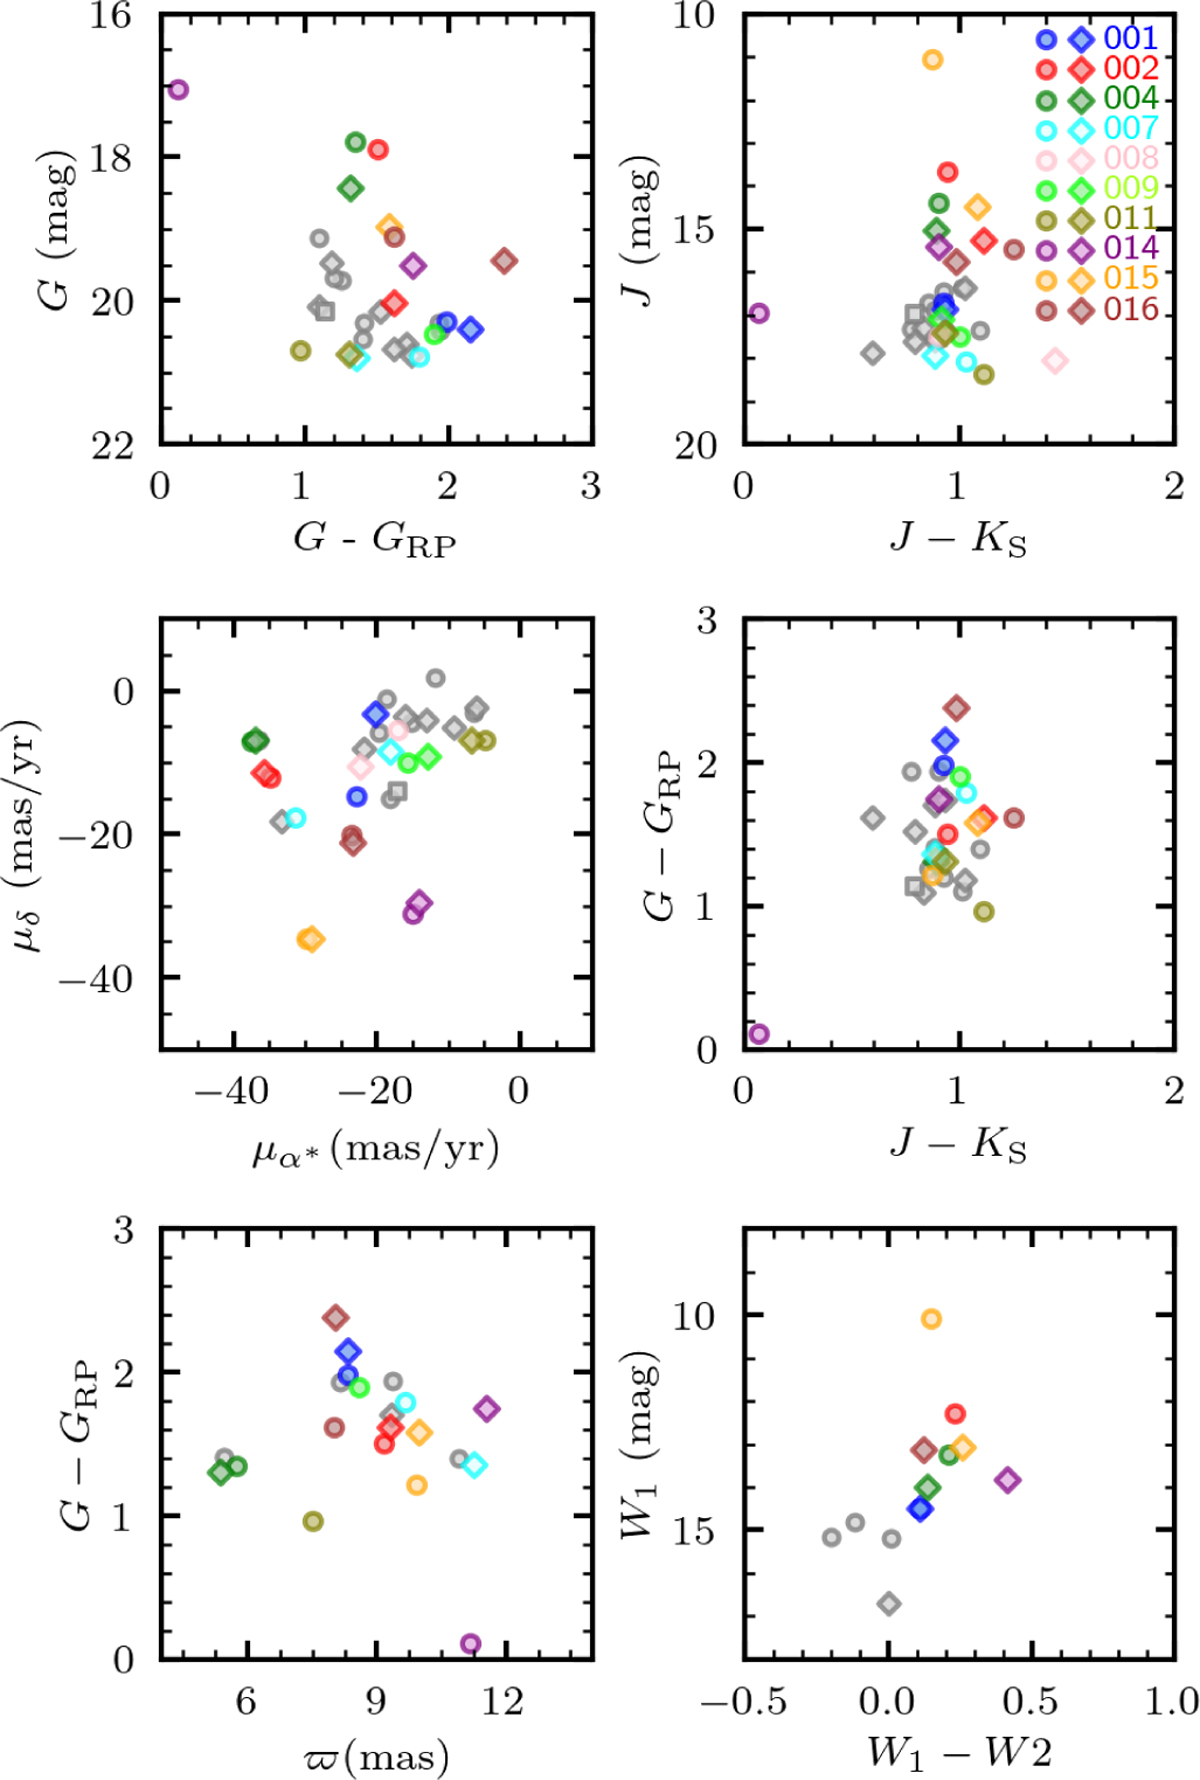
Top panels: observed CMDs in the visible (left) and near-IR (right) for the sample objects from Table 1. Colored circles and diamonds represent the A and B components of each pair for which the parallax difference is consistent within parallax errors, while gray errorbars represents systems with discrepant parallaxes. Note the narrow color-spread in the near-IR CMD, compared with the wide color span exhibited by the targets in the optical CMD. Middle panels: the Gaia DR3 PM vector diagram (left) and visual-near-IR color-color diagram. Bottom panels: Gaia DR3 parallax distribution as a function of Gaia color index (left) and the unWISE CMD for the systems with available photometry (right).
Current usage metrics show cumulative count of Article Views (full-text article views including HTML views, PDF and ePub downloads, according to the available data) and Abstracts Views on Vision4Press platform.
Data correspond to usage on the plateform after 2015. The current usage metrics is available 48-96 hours after online publication and is updated daily on week days.
Initial download of the metrics may take a while.