Fig. 2
Download original image
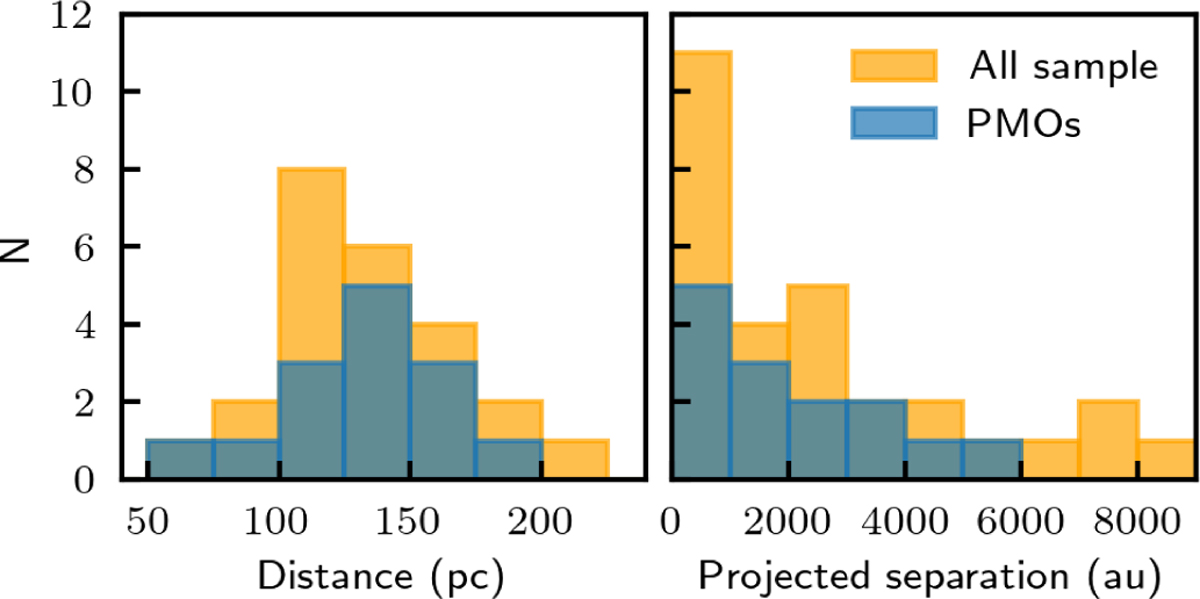
Left panel: sample distance distribution in parsecs. Right panel: distribution of projected separations in au, adopting the parallax distances. While tighter systems seem to be more common, we note that this distribution appears fairly flat when plotted in logarithmic scale. In these histograms, planetary-mass objects are painted in blue, while the whole sample is in yellow.
Current usage metrics show cumulative count of Article Views (full-text article views including HTML views, PDF and ePub downloads, according to the available data) and Abstracts Views on Vision4Press platform.
Data correspond to usage on the plateform after 2015. The current usage metrics is available 48-96 hours after online publication and is updated daily on week days.
Initial download of the metrics may take a while.