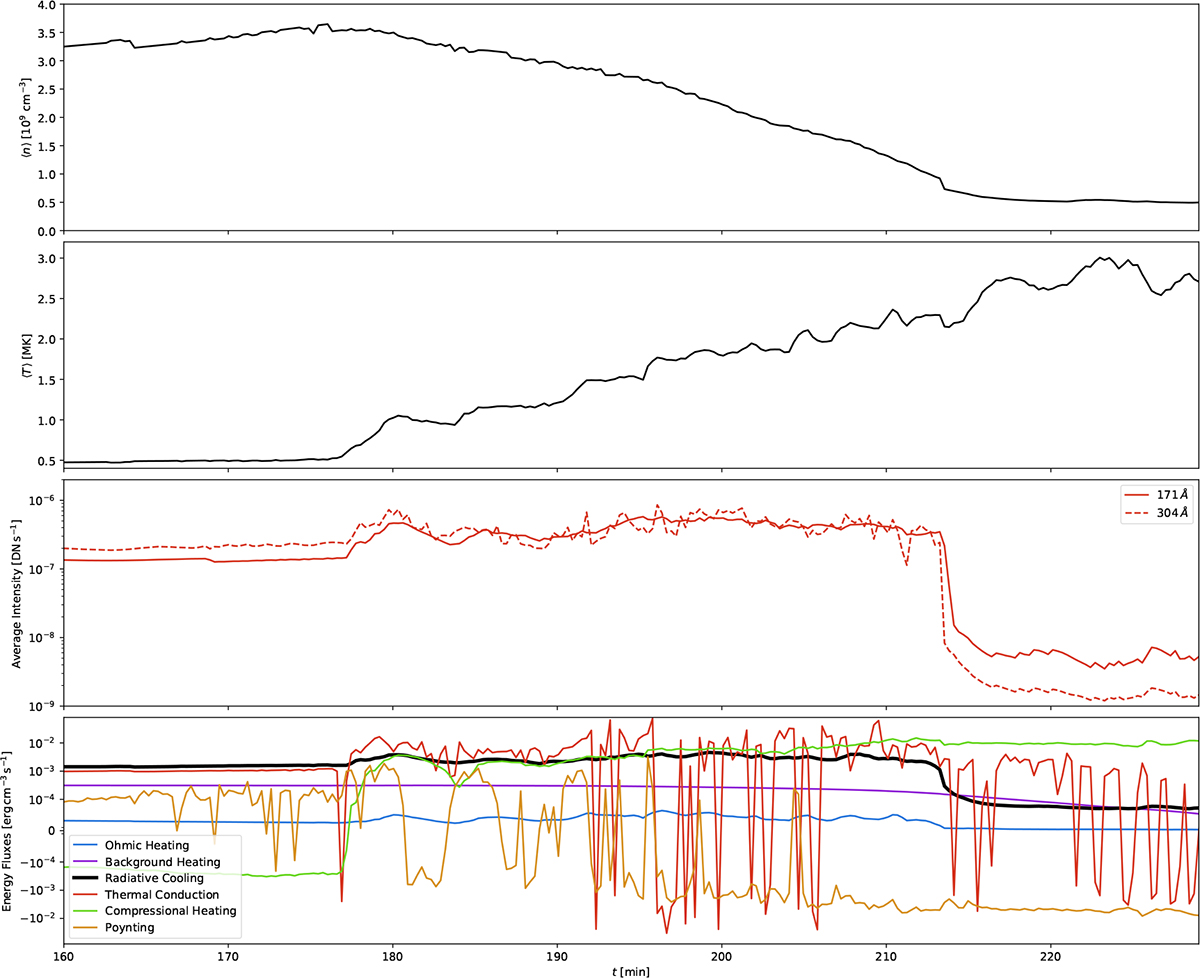
Fig. 9.
Download original image
Evolution of the average density in 109 cm−3 (first panel), average temperature in MK (second panel), average synthetic 171 Å and 304 Å intensities in DN s−1 (third panel), and the relevant energy fluxes from the energy equation (fourth panel). All quantities are averaged within a region around the prominence indicated in Fig. 8. In the fourth panel we display the absolute value of radiative cooling. The data include averaged values before, during, and after the evaporation.
Current usage metrics show cumulative count of Article Views (full-text article views including HTML views, PDF and ePub downloads, according to the available data) and Abstracts Views on Vision4Press platform.
Data correspond to usage on the plateform after 2015. The current usage metrics is available 48-96 hours after online publication and is updated daily on week days.
Initial download of the metrics may take a while.