Fig. 5.
Download original image
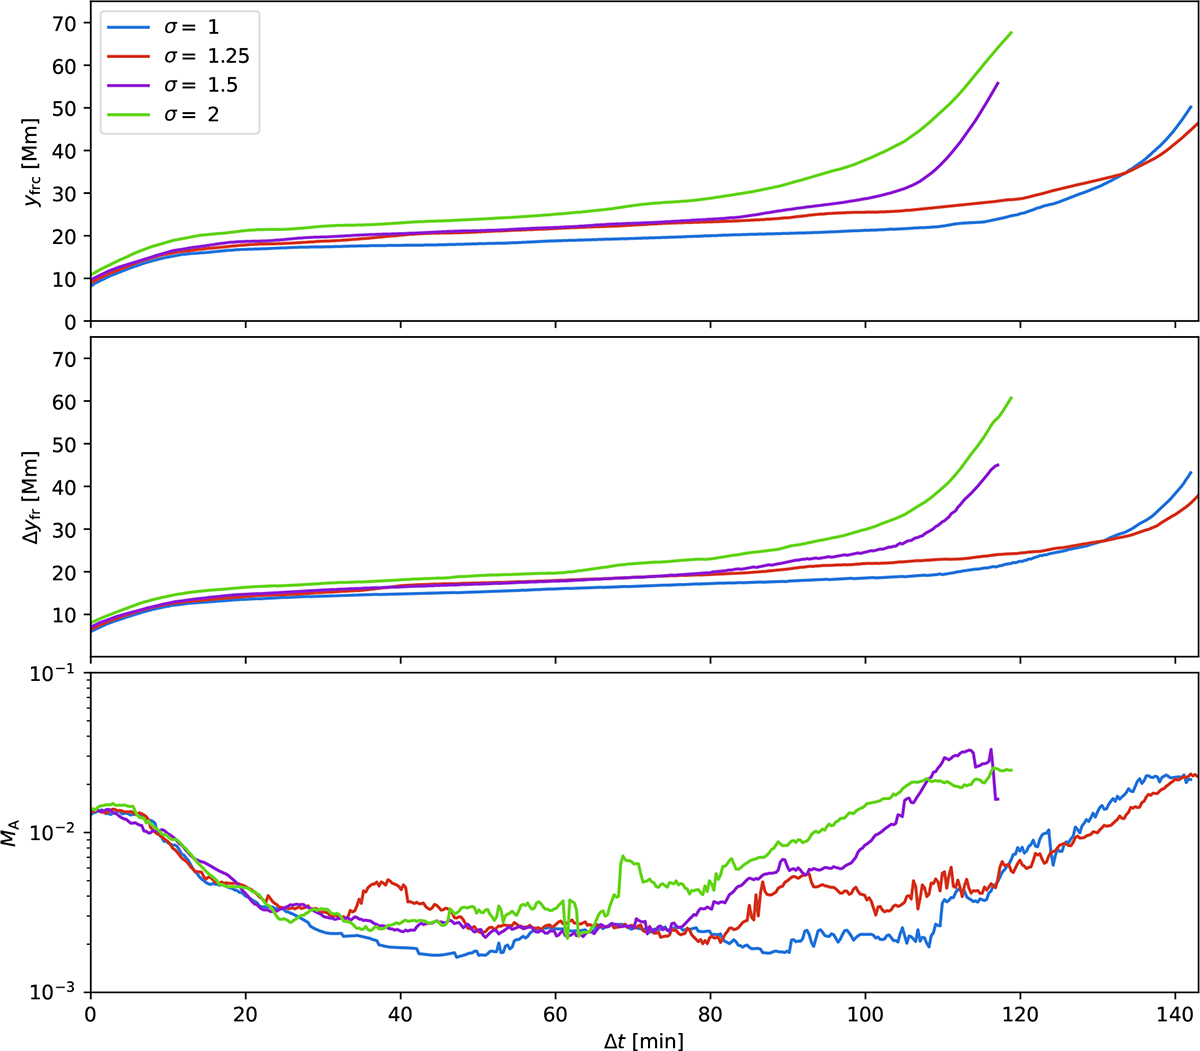
Evolution of flux rope center and vertical dimension for erupting cases σ ∈ {1, 1.25, 1.5, 2} due to magnetic reconnection. Top panel: Height evolution of the flux rope center, yfrc. Middle panel: Vertical length of the flux rope, Δ yfr. Bottom panel: Inflow Alfvén Mach number, MA. The time axis is expressed as Δ t = t − tfr, relative to the onset of flux rope formation, tfr. All curves in the current figure terminate before the formation of their first plasmoids.
Current usage metrics show cumulative count of Article Views (full-text article views including HTML views, PDF and ePub downloads, according to the available data) and Abstracts Views on Vision4Press platform.
Data correspond to usage on the plateform after 2015. The current usage metrics is available 48-96 hours after online publication and is updated daily on week days.
Initial download of the metrics may take a while.