Fig. 13.
Download original image
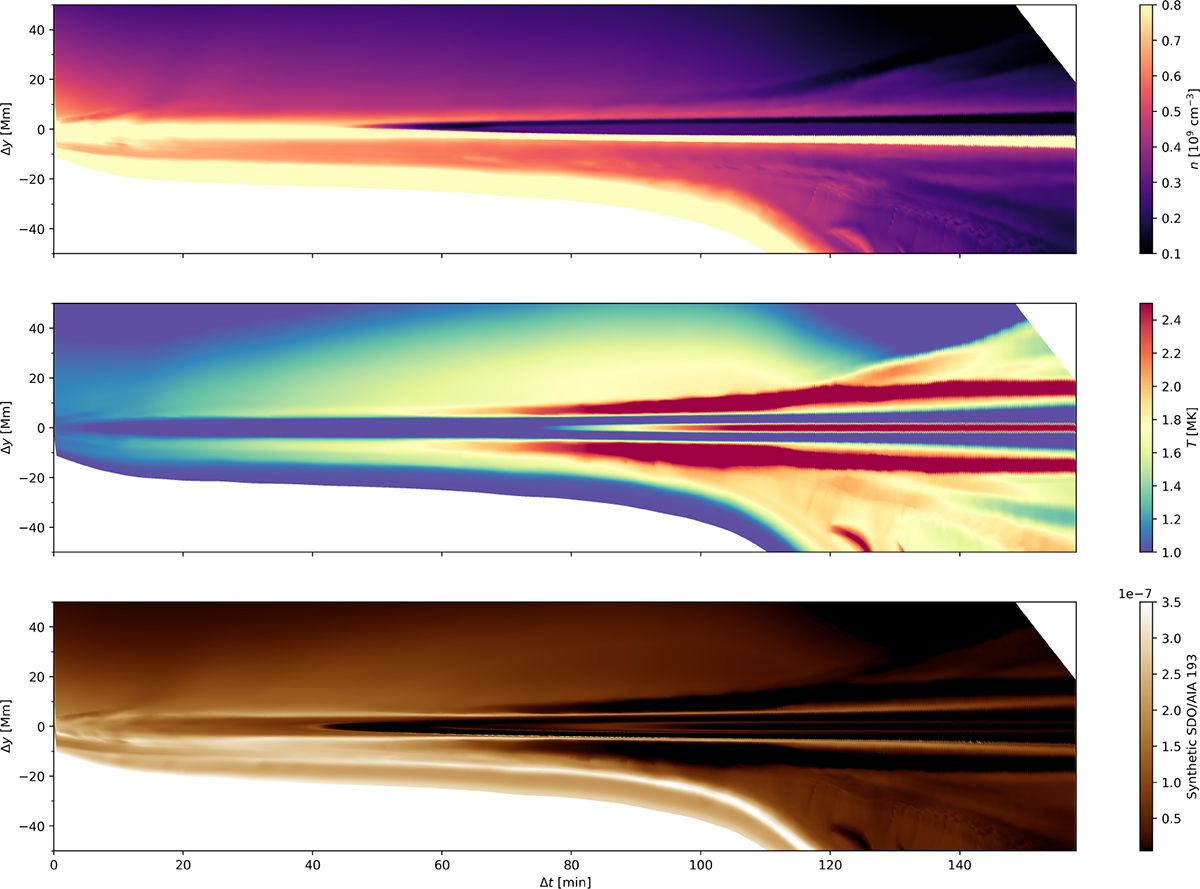
Evolution of the density in 109 cm−3 (top panel), temperature in MK (middle panel), and intensity in the synthetic 193 Å channel (bottom panel) along the central vertical axis x = 0 in the reference frame of the flux rope center. The height with respect to the flux rope center is denoted by Δ y, and the time relative to the moment when the flux rope center is tracked is denoted by Δ t.
Current usage metrics show cumulative count of Article Views (full-text article views including HTML views, PDF and ePub downloads, according to the available data) and Abstracts Views on Vision4Press platform.
Data correspond to usage on the plateform after 2015. The current usage metrics is available 48-96 hours after online publication and is updated daily on week days.
Initial download of the metrics may take a while.