Fig. 5
Download original image
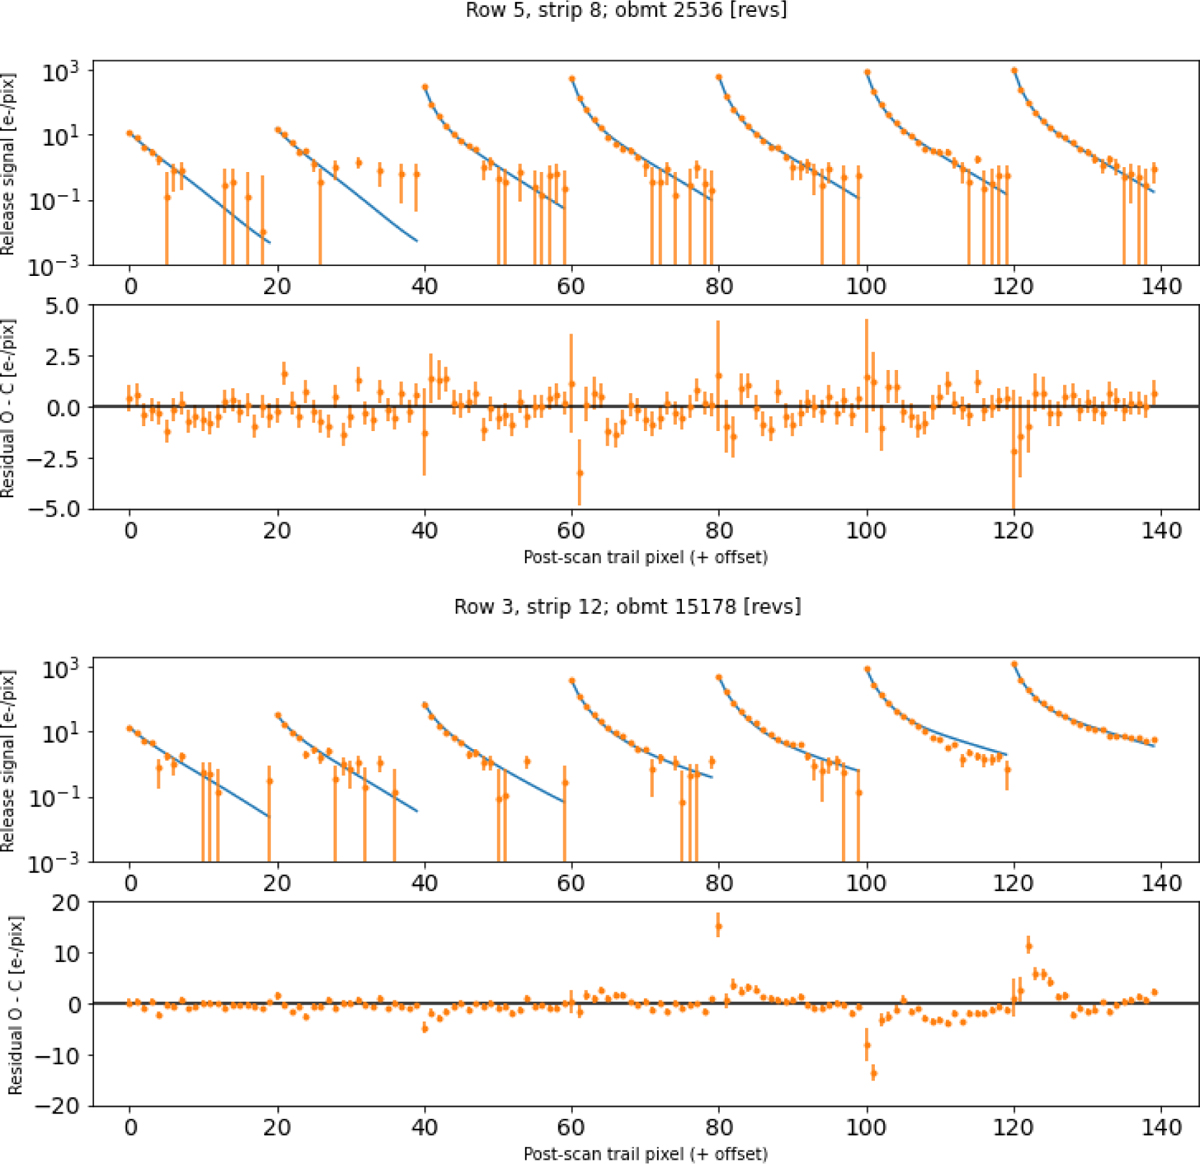
Calibration data (orange points with measured uncertainties), final models (blue lines), and residuals for three-trap species CtiPixel models for two devices and epochs: A typical calibration for row 5, strip 8 (=AF5) near the start of the mission at OBMT 2536 revolutions (upper panels), and a poor example for row 3, strip 12 (=AF9) towards the end of the mission. The calibration data consist of seven individual post-scan trails, measured over a wide range in injected signal level, and having a length of 20 pixels each; they are shown concatenated in these plots for convenience.
Current usage metrics show cumulative count of Article Views (full-text article views including HTML views, PDF and ePub downloads, according to the available data) and Abstracts Views on Vision4Press platform.
Data correspond to usage on the plateform after 2015. The current usage metrics is available 48-96 hours after online publication and is updated daily on week days.
Initial download of the metrics may take a while.