Fig. 2
Download original image
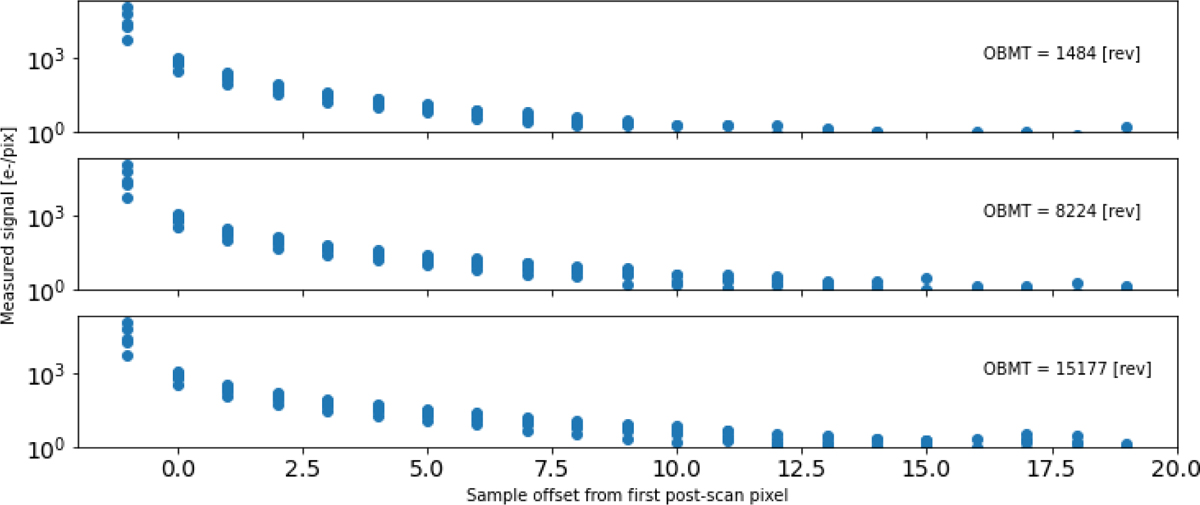
Example charge trails from three epochs of Gaia in-orbit serial CTI calibration activities. The mean level of the charge injection in the image section CCD columns is shown before the start of the post-scan measurements illustrating the change of two orders of magnitude in the commanded blocks. A small increase in serial CTI is observed from early to late epochs in the mission time line, particularly for the release signature at longer timescales. These data come from device AF5 in row 5 near the middle of the focal plane array.
Current usage metrics show cumulative count of Article Views (full-text article views including HTML views, PDF and ePub downloads, according to the available data) and Abstracts Views on Vision4Press platform.
Data correspond to usage on the plateform after 2015. The current usage metrics is available 48-96 hours after online publication and is updated daily on week days.
Initial download of the metrics may take a while.